Application of Thermographic Analysis to the surveillance and study of Mount Rainier Volcano and other Cascades Volcanoes
InfraMation 2018 Application Paper Submission
Daniele D’Accardi
ABSTRACT
Volcanoes can be monitored with the use of Thermography. The surface of every material has a specific Emissivity(ε) defined as the measure of an object's ability to emit infrared rays that comes from the quantity of infrared rays emitted by the same material, e.g. irradiated from the same body during time. Volcanoes, which are dynamic and not simply static objects, emit variation of the quantity of Energy accumulated and stored under forms of sensible variations of temperature. In the phases of major activity and in proximity of an eruptive event, they emit major heat gradient and consequently more infrared rays, and this is the purpose of the surveillance through thermal cameras. To this scope it is in operation already, in the Mediterranean Area, in Europe, a Remote Sensing platform called TIIMNET (Thermal Infrared Imagery Monitoring NETwork) for the active monitoring in real time of the thermal fluxes of volcanic areas of the Campania Region district: Vesuvius and Phlegraean Fields. This project can be extended even to the Active Surveillance of Mount Rainier and of other Cascades Active Volcanoes. Thermal imaging data, especially when used together with other monitoring techniques (such as seismicity, GPS measurements, and gas emissions), helps to determine the nature of potential volcanic hazards. Establishing a time series of the temperature changes together with other data series from the volcanoes as like the support of integrated satellites images in conjunction with the most recent modern software and programs of imaging analysis can better picture its past and trace finely present and future behavior with the aim to be especially ready and promptly able to alert efficiently and in a decent time frame the population of all Areas interested in the case of sensible changes in all parameters of the system for which thermal anomalies are one of the fundamental warning features.
INTRODUCTION
In the recent years many researches and practical application have been performed in the field of Thermography through thermal cameras with particular and effective emphasis on the study of a Volcano behavior.
In non-eruptive periods, the study of temperature variations in thermally active volcanic areas is essential to detect precursory signals of volcanic unrest. The methodologies applied by volcano observatories for monitoring of volcanic activity include searching for variations in the thermal pattern of volcanic features such as active fumaroles, hydrothermal systems, and open vents and fractures (Flynn et al., 2001). Routine thermal surveys by portable or satellite imagers have been used to help understanding long-term temporal variability of volcanic thermal anomalies, shedding light on small change in a volcano's regime that would warrant implementation of a more sophisticated monitoring system (e.g., Dehn et al., 2000; Galingo et al., 2008). Higher magmatic activity is expected to cause a higher flux of volcanic gases to the surface, and an increase in the fumarole temperatures has often been observed prior to eruptions or during shallow magma intrusions (Menyailov et al., 1986).
For example, a central issue of modern volcanology is to understand the trigger mechanisms of unrest in active volcanic areas [Newhall and Dzurisin, 1988; Lowenstern et al., 2006; Troise et al., 2006; Gottsmann and Marti, 2008]; these are usually affected by important hydrothermal circulation, the surface expression of which is in general a fumarole field and associated hot soils. The heat flux released from these hydrothermal manifestations has been shown to be the main term in the total energy budget for the few volcanic systems where it has been measured.
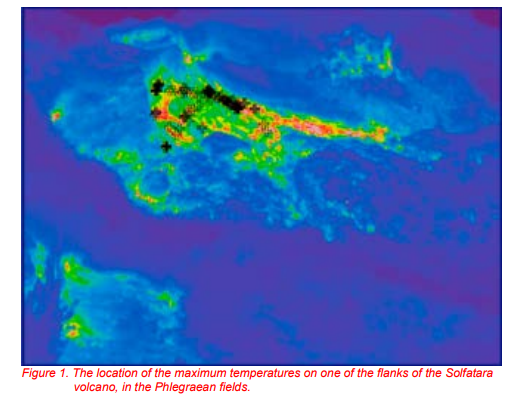
At Campi Flegrei caldera (CFc) in Italy, for example, the heat output of the hydrothermal site of Solfatara (Figure 1) is ~100 MW, which is an order of magnitude greater that the energy released by seismic activity.
However, some studies have been carried out on volcanoes more recently with better resolution during their unrest phases to investigate the possibility of using the spatiotemporal variations of thermal anomalies as indicators of changes in volcanic activity toward more dangerous conditions: [Matsushima et al., 2003; Chiodini et al., 2007; Harris et al., 2009; Spampinato et al., 2012; Pantaleo and Walter, 2014], “Long-term TIR imagery processing for spatiotemporal monitoring of surface thermal features in volcanic environment: A case study in the Campi Flegrei (Southern Italy)” [(Vilardo et Al.], “Use of Thermal Infrared Imaging for Monitoring Renewed Dome Growth at Mount St. Helens”, 2004 [David J. Schneider, James W. Vallance, Rick L. Wessels, Matthew Logan, and Michael S. Ramsey] amongst the more relevant.
Seismic and ground-deformation monitoring networks have been the only main surveillance networks at volcano observatories for many decades. In the last years, advances in remote sensing for studies of volcanic activity made data from ground-based, airborne and space- borne sensors an essential component of volcano surveillance systems [e.g. Ernst et al. 2008]. Among the several new remote sensing techniques for volcano monitoring, ground-based thermal image data collection has proved to be particularly useful to investigate quick processes associated to volcanic eruptions such as opening of eruptive fissures or potential opening of fractures related to new eruptive activity, phreatic explosions or increasing in hydrothermal activity and related possibility of the firsts, lava flow fields evolution, lava dome activities, morphological variations at vents, crater floor collapses, and pyroclastic flow deposit emplacement and cooling. A comprehensive over- view of the use of infrared thermal cameras at active volcanoes can be found in Spampinato et al. [2011].
The great advantage the thermal cameras have over non-imaging radiometers for example or in situ thermocouples is the provision of detailed spatial data. This characteristic makes it much easier to identify the widening or narrowing of hot areas or localized temperature changes, opening/closure of hot springs and fumaroles and their migration, which provide windows into the subsurface processes occurring in magmatic–hydrothermal systems (e.g., Chiodini et al., 2007; Hernández et al., 2007; Harris et al., 2009; Spampinato et al., 2010).
Originally the Thermal surveys of Volcanoes started with from Spaceborne Remote sensing-based observation with programs like ASTER (Advanced Spaceborne Thermal Emission and Reflection Radiometer) or MODIS.
The detection limit of satellite-based measurements of thermal emissions was and it is largely a matter of spatial resolution. Except for very large thermal features (such as lava lakes, crater lakes, and pyroclastic flow deposits), most sources of volcanogenic heat are subpixel in size when viewed with moderate resolution sensors such as ASTER (90-m pixels) or coarse-resolution sensors such as AVHRR or MODIS (1-km pixels).
Thus, the signal detected by the satellite is a pixel-integrated value of (at least) a hot and a cold (background) component. For a thermal anomaly to be detected, the proportion of hot material within a pixel, or the temperature of the hot component, needs to increase to the point where the integrated temperature exceeds a threshold (compared to neighboring pixels). It follows that the smaller the spatial resolution of a sensor, the more sensitive it will be to detect anomalous pixels.
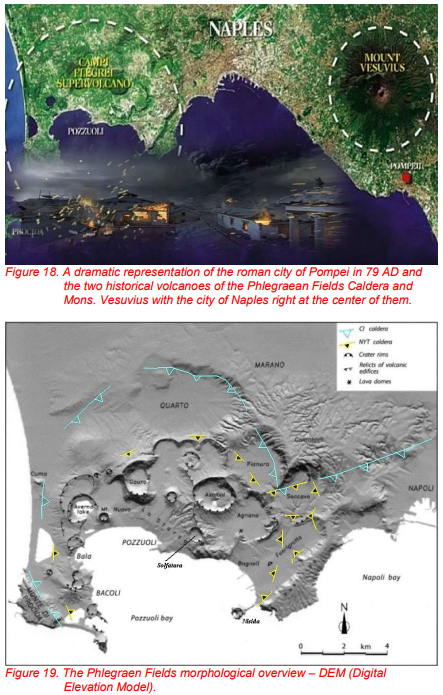
One of the most suitable examples of automated long-term thermographic analysis is in the Campania Region Volcanic District in Southern Italy formed by the two different as well as known and dangerous volcanoes of Mt. Vesuvius and the Phlegraean Fields caldera, located respectively South-West and North- East of the city of Naples, Italy.
PROCEDURES, DATA, CASE HISTORIES, AND EXAMPLES
Although infrared radiation (IR) is not detectable by the human eye, an IR camera can convert it to a visual image that depicts thermal variations across an object or scene. IR covers a portion of the electromagnetic spectrum from approximately 750 to 15,000 nanometers (0.75–15 µm). IR is emitted by all objects at temperatures above absolute zero, and the amount of radiation increases with temperature.
Even rocks, hot rocks, and hot gases coming from underground, are a great target for thermographic analysis.
The great advantage the thermal cameras have over non-imaging radiometers for example or in situ thermocouples is the provision of detailed spatial data. Thermocouples were used traditionally as tool for measuring in situ the temperatures of a volcano’s flanks. And they are used still to make a rough measure of the temperature to make a calibration of the thermal image captured. This characteristic, of gather much more detailed spatial temperatures data, makes it much easier to identify the widening or narrowing of hot areas or localized temperature changes, opening/closure of hot springs and fumaroles and their migration, which provide windows into the subsurface processes occurring in magmatic–hydrothermal systems (e.g., Chiodini et al., 2007; Hernández et al., 2007; Harris et al., 2009; Spampinato et al., 2010).
Emissivity as we know is a measure of how much energy is emitted from an object compared to a theoretical perfect emitter known as a blackbody. In nature, all materials emit less energy than a blackbody, because energy is absorbed by the vibration of molecular bonds. They are referred to as selective radiators wherein emissivity varies as a function of wavelength. Although the emissivity of silicate rocks has a characteristic decrease in emissivity at a wavelength range of 8 to 10 µm, an average value over the broader range of 7.5 to 13 µm is used where measuring temperatures with a broadband radiometer.
Variations in emissivity can also occur for a given rock type as a result of vesicularity and particle size. In general, emissivity decreases as vesicularity decreases (Ramsey and Fink, 1999). Some lava is largely degassed and dense (Pallister and others, this volume, chap. 30), suggesting that the actual emissivity measured in these cases may be lower than a laboratory reference. Furthermore, very fine-grained silicates (<60 µm) exhibit a decrease in emissivity at wavelengths above 11 µm, owing to scattering of radiant energy (Ramsey and Christensen, 1998).
It is possible that ash fallout and (or) the cover of a chalky fault-gouge carapace serves to reduce the effective emissivity of the extruded lava (compared to the dacite reference value).
The effect of an overestimated emissivity would be an increase in the temperatures above those reported herein. The result of a variation in emissivity is tested by changing the value by a factor of 0.1 within the ThermaCAM™ Researcher software, which results in a change in temperature on the order of 20ºC for an area with a temperature of 450ºC. Thus, variations in emissivity may account for changes on the order of 5 percent in the absolute temperature recorded.
Measuring temperatures of fumaroles is of extreme importance in order to gather any transition in the volcano behavior. Temperatures of the fumarole can be surveyed even for understanding the possibility of a phreatic explosion is close (as it happened at Mt. St. Helens in 2004) that even and especially in the case of a volcano like Mt. Rainier could be of tremendous impact because of the presence of Ice and snow on most of the top and the flanks of the mountain. That would lead soon to a detachment of them and probably to a mud-flow of big proportions.
It is significant to note that in the event of Mt. S. Helens in 2004, for example, the ash-rich explosion ice rupturing event, occurred in particular on October 1, began without any recognizable precursory seismicity (Moran and others).
One of the most suitable examples of automated long-term thermographic analysis is in the Campania Region Volcanic District in Southern Italy formed by the two different as well as known and dangerous volcanoes of Mt. Vesuvius and the Phlegraean Fields caldera located respectively South-West and North East of the city of Naples, Italy.
TiiMNET: a new and effective way to collect time series automated thermal data.
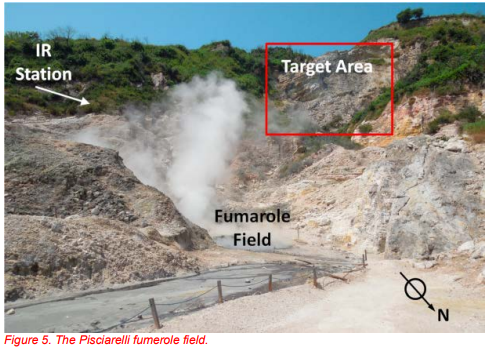
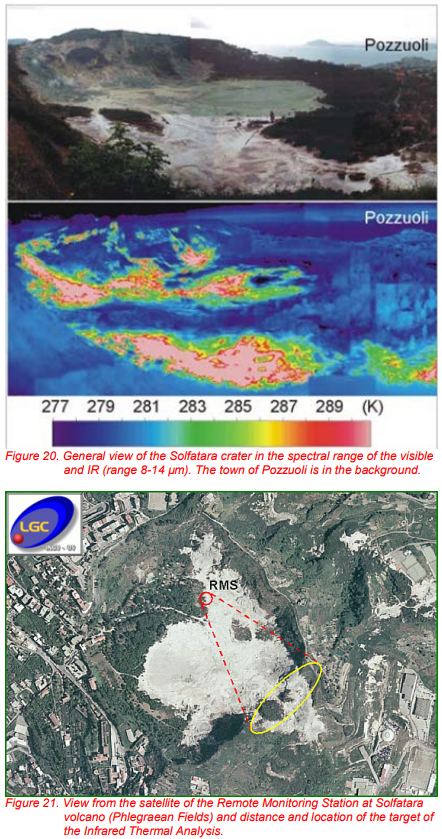
The Thermal Infrared Monitoring Network (TIIMNet) is planned for continuous, long-term volcanological monitoring by acquiring daily infrared images (LWIR in the range 8-14 µm) of fumaroles fields in the Neapolitan volcanic areas monitored by INGV-Osservatorio Vesuviano. The network is made up of three stations located, respectively, at Vesuvius crater, inside the Solfatara crater and at Pisciarelli (Fig. 1; Vilardo et al., 2008).
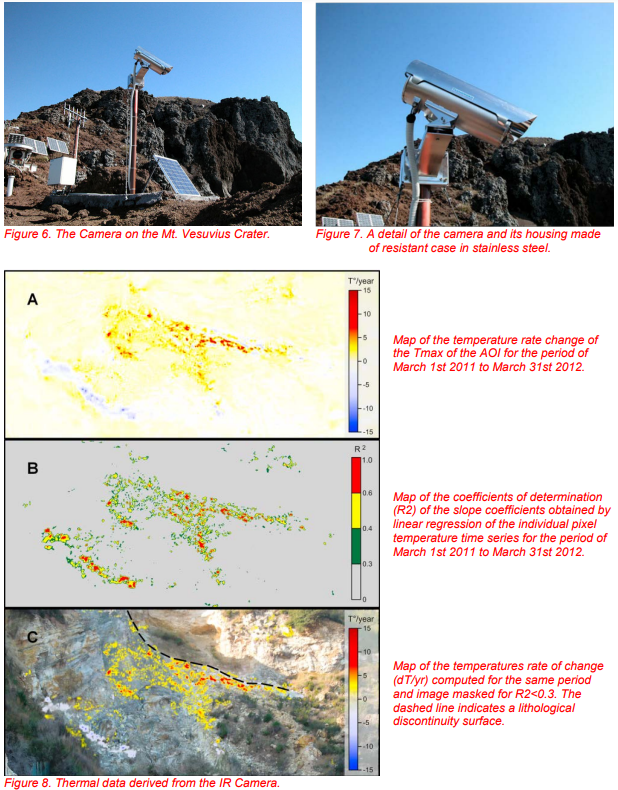
The IR cameras initially used at Solfatara and Pisciarelli were NEC Thermo Tracer TS7302 with focal plane array (FPA) uncooled microbolometer measuring systems (320x240 pixel). Now in use are more sophisticated cameras of the FLIR series. The first one, operative since July 2004, acquires scenes of the SE inner slope of Solfatara at the intersection of two active, SW-NE and NW-SE main faults where are located the major fumaroles (Fig. 1a’) at an average distance of about 300 m from the IR camera. The IR camera at Pisciarelli, operative since October 2006, acquires scenes of the outer eastern flank of the Solfatara tuff-cone (average distance of fumaroles is about 130 m), corresponding to an area characterized by heavy water vapor and CO2 emissions (Fig. 1b’). Both IR cameras are inside a protective stainless-steel housing, resistant to corrosive elements and with a shooting window of germanium glass, transparent to the thermal wavelengths; the cameras are connected to the Remote Monitoring Stations (RMS) which controls the shooting functionalities of IR sensors. The Control Unit, located at the surveillance center of INGV Osservatorio Vesuviano in Naples, communicates with the RMS through GSM frequency network and it allows to configure times and shooting parameters and to run the automatic uploading of the remotely acquired thermal images.
The IR camera now in use at Vesuvius is a FLIR ThermoVision A40 (FPA uncooled microbolometer, 320x240 pixel) which has been operating since July 2011 and acquires scenes of the SW inner slope of Vesuvius crater.
The camera, which is inside the same protective housing used for NEC cameras, is connected to a new RMS (Fig. 2a) with new and improved functionalities and more flexibility in respect of the old RMS used at Solfatara and Pisciarelli. The new RMS can be programmed to perform IR shots at prefixed times, with temperature and humidity corrections (using data from a T/h sensor), and to send the IR image by FTP to a specified host using Wi-Fi connection (accessible at Vesuvius crater).
The new TIR remote monitoring system: ICARO(ICARUS)
To solve the most critical technical issues and improve the flexibility of the entire instrumental chain, as well as to make any future upgrade easy, a new remote monitoring station was developed and installed at Vesuvius crater on July 2011. The new remote station at Vesuvius, named ICARO (Infrared Camera Automation for Remote Observation), consists of a new IR camera and an in-house developed Remote Monitoring Station (RMS) which operates a fully real-time control of data acquisition functionalities and transfer procedures.
The IR camera used at Vesuvius so as the others are positioned inside a stainless-steel protective housing (see Figure 7) with a shooting window made of germanium glass. FLIR A40 camera specifications are shown in Table 1.
The camera has also a RJ-45 Ethernet connection and the firmware allows air temperature and humidity corrections before the acquisition and guarantees compatibility with ThermoVision System Developers Kit.
IR IMAGE MONITORING AT VESUVIUS
The IR camera specifications are outlined in Table 1 below.
Type IR detector Focal Plane Array (FPA) uncooled microbolometer Resolution 320×240 px
Thermal sensitivity (50/60Hz) 80 mK @ +25°C
Spatial resolution (IFOV) 1.3 mrad
Spectral range 7.5 to 13 µm
Accuracy ± 2 °C or 2% of reading
Lens (24° lens) f1.0
Table 1. FLIR A40 technical specifications. (SDK) which provides full access to camera measurements using Windows ActiveX and MS.Net programming environment.
The Remote Monitoring Station (RMS)
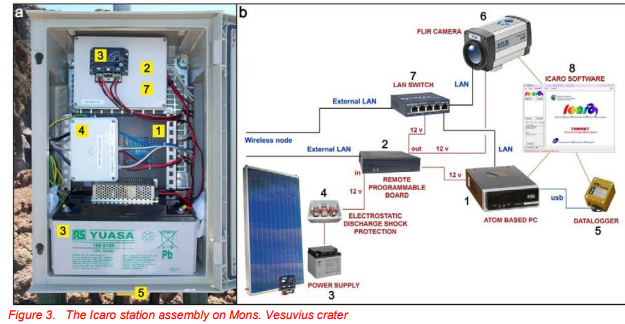
The RMS is made up of several components whose task is the acquisition of IR images and their uploading to the Surveillance Center. A detailed scheme of RMS components is reported in Figure 3. The RMS is composed of:
- An Atom based mini-ITX PC (Figure 3, no. 1) running the ICARO acquisition software on a Windows XP O.S.
- A Remote Programmable Board (RPB; Figure 3, no. 2) which is continuously connected to the Surveillance Centre of the Osservatorio Vesuviano (Italian National Institute of Geophysics and Volcanology, Naples section) by Vesuvius wireless node and manages the power on of all components on request or at fixed times.
- A power supply system composed of a battery, a Solar panel and a DC voltage controller (Figure 3, no. 3).
- An electronic protection of external connections to shocks due to electrostatic discharges from lightings
- during thunderstorms (Figure 3, no. 4).
- A USB datalogger (model TinyTag; Figure 3, no. 5) for air temperature and humidity measurements.
- The IR camera (FLIR model A40; Figure 3, no. 6) with LAN connection.
- A LAN switch to connect PC and IR camera to the Osservatorio Vesuviano Surveillance Centre by using Vesuvius wireless node (Figure 3, no. 7).
The procedures for IR image acquisitions consist of the following phases:
- a) on the basis of programmed times for IR acquisition, the RPB switches on the Atom PC, the IR camera and the LAN switch;
- b) the Atom PC connects to TinyTag datalogger and acquires air temperatures and humidity values; c) the ICARO software (Figure 3, no. 8) running on Atom PC connects to IR camera and configure it with all necessary parameters including the acquired air temperature and humidity values; d) the IR camera acquires IR scene which is stored on Atom PC;
- e) the ICARO software on Atom PC connects to the Osservatorio Vesuviano Surveillance Centre by Vesuvius wireless node and upload IR image data just acquired;
- f) the ICARO software uploads daily temperature and humidity data to Surveillance Centre servers and eventually downloads new configuration to use for next IR image acquisitions; g) when all acquisition procedures ended the RPB switches off Atom PC, IR camera and LAN switch and remains in stand-by mode ready for any request of connection from the Surveillance Centre or waiting to perform the next daily acquisition at the scheduled time.
The RPB allows also a real-time activation of the Atom PC and IR camera in order to acquire scenes on demand or reconfigure the system by using ICARO software or a Remote Desktop connection from any Windows PC.
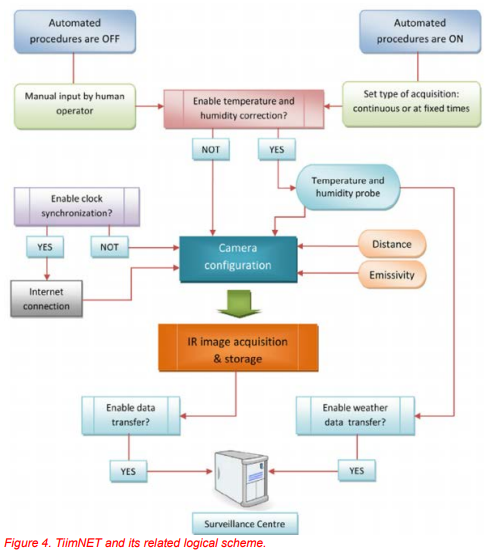
The flow-chart of main station procedures is reported in Figure 3. The RMS, in absence of any connection with the Surveillance Centre, can acquire data for months as it can rely on a large internal data storage capability.
Optionally, the station can be easily equipped with a conventional video camera which can transmit the analog signal using a video server hardware. (Sansivero et Al.)
ICARO Remote Monitoring Station at Vesuvius (3) and the related logical scheme (4). A key element of the acquisition system is the Remote Programmable Board (RPB). This component is equipped with Ethernet port, for the TCP/IP connections, and a control interface to manage the input/output lines.
It consists of two logical sections 1) a programmable microcontroller card based on a series 2000 Rabbit processor board; 2) a secondary board controlling ULN2003A 4 relays capable of handling loads up to 5A.
The firmware inside the microcontroller allows to:
- configure a timer for no. 4 I/O lines on the secondary board (Figure 4a, no. 3); b. synchronize the timer with NTP clock or manually;
- turn on and off manually each I/O line;
- reset to default parameters.
The bootstrap phase initializes the I/O lines, as well as, the parameters needed to properly configure the Ethernet interface and start the server daemon, which will remain on hold to accept connections on a IR IMAGE MONITORING AT VESUVIUS.
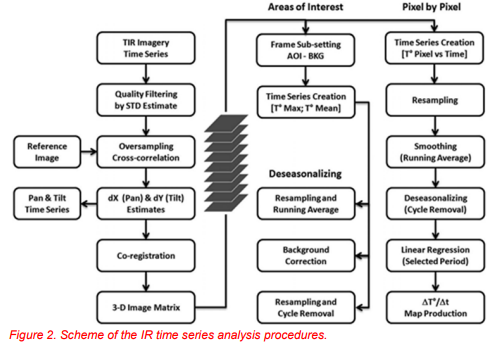
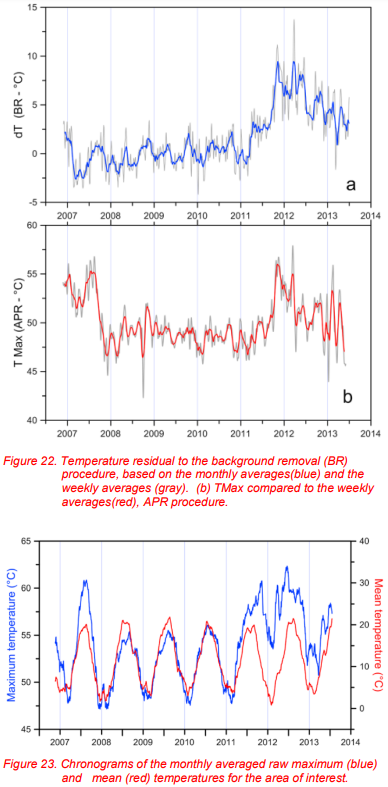
To highlight the temperature changes caused by variations in the endogenous source, this dominant effect of the environmental parameters had to be removed from the data. For this purpose, three different procedures were applied: (a) moving average smoothing (MAS), (b) background removal (BR), and (c) analytical periodicity removal (APR).
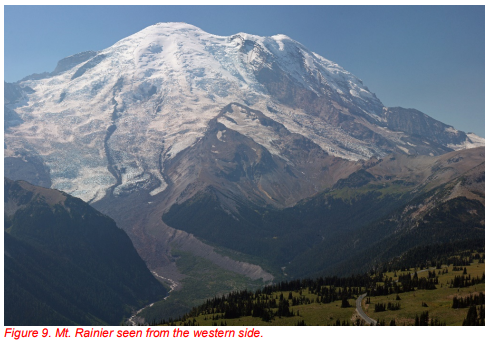
A different approach for seasonal pattern correction is seen in the use of the BR procedure (Background Removal) [Chiodini et al., 2007; Sansivero et al., 2013]. This empirical procedure is based on the observation of a correlation between the Tmax of a portion of the scene that is selected as the background (Figure 3; BKG) and the Tmax of the AOI (Figure 9a). Here the choice of the background area strongly influences the effectiveness of this procedure, so this area has to be carefully selected from the TIR images to be outside the region affected by any thermal anomaly andhis empirical procedure is based on the observation of a correlation between the Tmax of a portion of the scene that is selected as the background.
Commonly, measurements are made at night to avoid solar reflection and to minimize effects of solar heating of the surface (Calvari et al., 2005a, 2005b; Chiodini et al., 2007; Harris et al., 2009). It is also helpful to work during favorable meteorological conditions (low humidity, fog or cloud) so that the atmosphere is more transmissive. We used ThermaCAM™ Researcher software to calculate atmospheric transmissivity using measured values of the ambient air temperature, relative humidity, and atmospheric path length (from the object to the camera).
FLIR Systems ThermoVision™ A40 is the preferred camera for fire prevention and fire detection in solid waste bunkers.
Figure 4. shows the extremely flexible approach of the Thermal camera surveys in TiimNET system: the camera can be set as continuous long term fixed thermal features surveys or can be set and controlled in remote by the operators with all the activation or not activation of the relative parameters.
Although the cameras are intrinsically temperature-calibrated and setting especially the right emissivity and the parameters correctly, numerous extrinsic field conditions can result in the measured, or apparent, temperature being different than the actual surface temperature (Ball and Pinkerton 2006 Harris 2013, Additional file 2). The apparent temperature measured by the cameras will usually be lower than the actual surface temperature for several reasons. First, volcanic fume between the target surface and the camera will attenuate the radiant signal of the surface significantly (Sawyer and Burton 2006). In some cases, particularly if there is much condensed water in the plume, the target surface may be entirely blocked by fume.
Second, an individual pixel temperature will be a composite of all the temperatures within the pixel footprint. If the hot target is small and the majority of the pixel area is cooler, this “mixed pixel” issue results in the pixel-integrated temperature being significantly lower than that of the hot target. The pixel footprint size therefore plays a part in the temperature accuracy—and effective sensitivity—of the cameras (Ball and Pinkerton 2006). This relates to another limitation of the cameras: some thermal camera images tend to be very low resolution (Spampinato et al. 2011). The cameras used in this study have image sizes of 320 × 240 pixels (0.08 megapixels), which was the standard resolution available for this type of camera in 2010. At a distance of 200 m, the pixel footprint for the 53° lens would be about 62 cm wide.
In addition, crater surveying data are strongly affected by high concentrations of SO2 (sulfur dioxide) present in the heavy gas emissions from the volcano. Errors on these images can vary from 10 to 20%.
In the case of blurred images, which can be due to the presence in the acquired image of the gas plume from the fumarole field, the correlation matrix would show a peak that did not represent an image shift, and the coordinates of such a peak were outliers of the DX and DY time series. The images with DX and DY values identified as outliers were not used in the subsequent analyses. To identify the outliers, a removal algorithm that uses the Cook’s distance was applied [Cook and Weisberg, 1982].
THE GIANT OF THE CASCADES: MT. RAINIER
Mount Rainier is an active volcano that towers more than 14,000 feet above expanding suburbs in the river valleys that lead to nearby Puget Sound. It is virtually certain that Mount Rainier will erupt again and that lahars, either eruption-related or not, will inundate valley floors that surround the mountain and are densely populated, causing severe social and economic impacts.
Most far-traveled lahars at Mount Rainier occurred during eruptive periods, whether generated by pyroclastic flows that swiftly melted snow and ice; by explosive expulsion of a crater lake; or by large landslides of wet, weakened rock on the steep upper flanks. Lahars generated by pyroclastic flows require that magma, or molten rock, rise to a shallow level and drive an explosion or flow out onto the surface to create a lava flow. Rising magma is typically heralded by earthquake swarms, deformation of the cone and immediate area, and release of volcanic gases.
The written history of Mount Rainier encompasses the period since about A.D. 1820, during which time one or two small eruptions, many small debris flows, and several small landslides occurred. Our knowledge of the prehistoric record makes it clear that the written record is simply too brief to guide us in estimating the future behavior of this half million-year-old volcano. Interestingly, Native American oral traditions record apparent eruptions and lahars, but offer few details about the character or date of such events. During the past 10,000 years, eruptions of Mount Rainier did not occur at regular time intervals but were clustered in eruptive periods that lasted several decades to more than 1000 years. Eruptive periods were separated by apparent dormant intervals that lasted from several centuries to almost 2000 years. Such an irregular pattern of activity makes predicting the onset of future eruptions impossible and highlights the importance of maintaining a robust geophysical-monitoring network on the volcano in order to detect the early-warning signs of volcanic unrest that may herald renewed volcanism. Typical eruptions of Mount Rainier produce a variety of potentially high-energy explosions ejecting tephra (volcanic rock fragments of all sizes). Sand and dust-sized tephra can drift downwind from the volcano for tens to hundreds of miles. Most of the cone is built of lava flows that oozed from vents and flowed down the steep flanks of the volcano. Both explosions and collapse of active lava flows on steep slopes generate hot pyroclastic flows that swiftly melt snow and glacier ice to produce mixtures of water, rocks, and mud called lahars (or volcanic mudflows) that may sweep many tens of miles down valleys. Landslides of weakened rock can also spawn lahars. Such landslides occur most often during eruptive periods but can also occur during dormant intervals under certain conditions. (Official Mt. Rainier Volcano Hazard Plan WORKING DRAFT October 2008”).
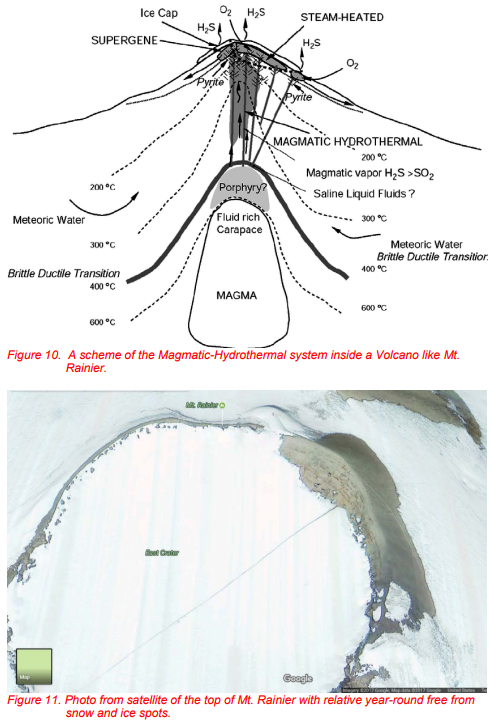
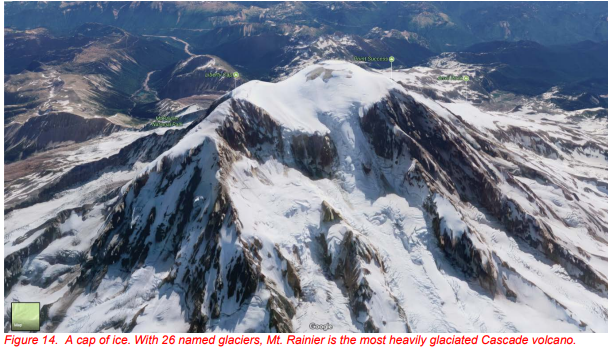
On top of Mount Rainier there are hot spots! As it is possible to notice them, on clear days especially, it’s not hard to understand that some good parts of the top of the crater sides are free of snow and ice because of hydrothermal heat flowing from below. It’s well known even the presence of an intricate web of ice caves on the top of the mountain, mostly carved from heat and hot gas exhalations. That could be a great opportunity for closely monitoring the behavior of the Volcano.
Of course, the possibility to place eventually some stations on the very top of the mountain must be well evaluated but it can be realized with the correct planning. In fact, it’s under everybody’s eye the fact that climbing the top of the Mountain is very difficult and especially when such an equipment must be carried all the way up. A possible way to do it could be to hang down occasionally the equipment from a
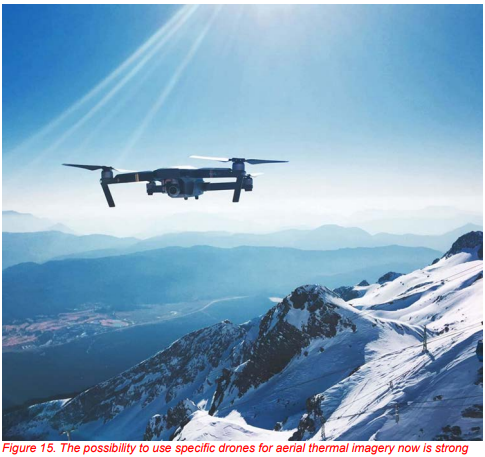
helicopter (this would still be much cheaper than using a helicopter for several surveys) at a pre-set time to a scientist or team of scientists gotten to the top in the set location, and then install it in the place set as fixed station. After all the equipment itself is made of a strong concrete base, an iron tripod and a box with the mini-computer and the others small devices. All the operation would require not more than two days for installing and let the station run on. However, the greatest opportunity that comes handy nowadays comes from the always more effective and spreading use of drones. There are already available on the market specific drones with the capability to carry on thermal cameras and with a decent time frame of operability that makes the surveying easier, faster and more efficient in terms of reachability of targets otherwise difficult to reach at close effective distances for the thermal imageries capture and analysis.
Hot cracks.
To investigate the potential opening or development of fractures related to new eruptive activity, thermal imaging has been applied to monitor the stability of volcanic edifices. One big example over the others. In the early 1980s, three days after the first 1980 Mount St. Helens eruption, thermal imagery of the summit area was carried out by U.S. Geological Survey (USGS) in order to identify thermal anomalies (e.g., hot cracks) that might have preceded a flank eruption or landslide and debris avalanche (Kieffer et al., 1981).
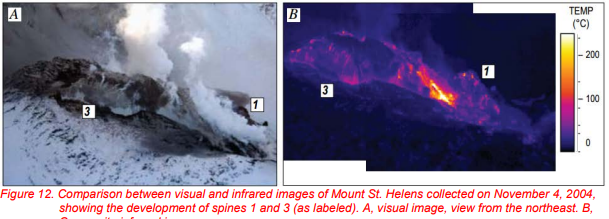
Thermal infrared images continue to be used at Mount St. Helens as a monitoring tool to observe dome growth and have documented the thermal characteristics of recumbent (whaleback) extrusion from November 2004 to April 2005, vertical spine extrusion from April to July 2005, and composite spine growth (composed of massive rock and disintegrating rock debris) from July 2005 to present (April 2007)
Thus, the gimbal-mounted instrument was largely untested for eruption response by the USGS when first flown at Mount St. Helens on October 1, 2004; arriving only 6 minutes prior to the initial phreatic explosion. The utility of the instrument was quickly recognized as it was determined rapidly that the initial explosion was of phreatic origin. This information was quickly radioed to the operations center at CVO and used to apprise land management and emergency response personnel.
Over the next several days, the thermal imaging system was able to record continued uplift in this region as expressed by displacement of thermal features and nearly continuous warm rockfalls. On the west end of the graben (fig. 4), the thermal expression of normal faulting was observed, suggesting that this area was not moving upward as rapidly as the east end. Although these features can be seen in visible images, the advantage of the thermal system was to highlight areas of interest during a time period of very rapid changes in surface topography. The thermal measurements at Mount St. Helens documented an increase in heat flow on October 10 as magma neared the surface. (Vallance and others).
The only ones that carried on some ground-based thermal surveys of Mt. Rainier at the beginning were Lange & Avent and R.M. Moxham of the USGS. In the mid-60’s to early 70’s they made detailed, ground based thermal surveys of selected slopes of Mount Rainier utilizing a Barnes PRT-5 Radiation Thermometer. They did not detect any significative anomalies except for some suspect thermal areas on the south, west and north sides of the volcano but a previous big anomaly detected in 1972 on the west side wasn’t redetected. However, since according to Lange and Avent “The survey did not redetect the thermal anomaly observed by the authors on the west side of Mt. Rainier in august 1972. This suggests that some thermally anomalous areas on the volcano may change their thermal characteristics within short periods of time.” That means the Rainier’s temperature may present short time-frame anomalies. They furthermore recognized how many of the mudflows, there included the famous recent Paradise, Osceola and Electron, may have been triggered by volcanic warming of ice and debris on the volcanoes rather than by earthquake or eruption and how much these kinds of surveys would have been important in the short and especially long periods.
Study of ice and snow condition using Infrared
According to several studies and in particular a study (2011) by Janet Lightaa*, Subashini Parthasarathyb, William McIverc of the University of New Brunswick in Saint John, Canada, ice condition can be monitored with the use thermal cameras equipped with infrared microbolometer sensors. Their technique is peculiar and used extensively even in order to gather more information in the oscillation driven by the recent Climate Change but primarily to gather condition like thickness, extension and characteristic of a certain ice sheet/body. They used a mix of Ultrasonic snow-depth technique and the use of a hand-held FLIR T640 camera a with a thermal sensitivity of 0.04C and pixel pitch of 25 μm to capture thermal images of ice conditions.
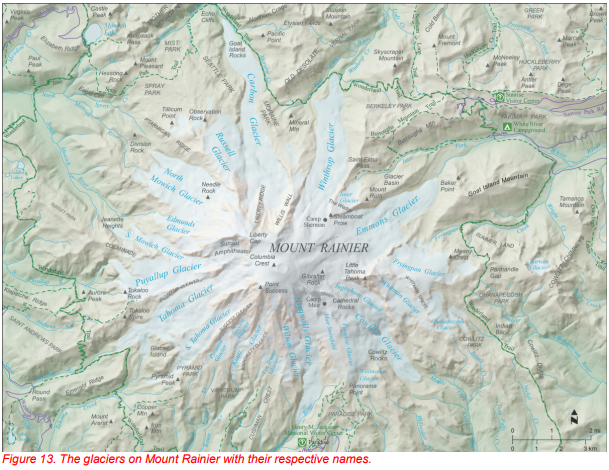
This technique is suitable and can be used extensively to capture any crack or sensible variation in thickness on the flanks on top of a Volcano like Mt. Rainier particularly, so heavily glaciated, and of the other peaks of the Cascade Range covered as well in snow and ice.
It’s notable to remember that on Mount Rainier for example there is an intricate web of open caves carved by gases and exhalation where some thermal imagery has been operated but without any real analysis of the ice/snow features influence around the interested targets.
Anyway, there is knowledge in literature of the use of infrared Thermography even using a simple consumer digital camera made in Japan of the fumarole area in the active crater of the Aso volcano, Japan in 2010 by Yoshitsugu Furukawa of the Kyoto University in which the author tested and used a small camera device at market prices and obtained appreciable results if compared to a dedicated infrared thermometer. In the recorded images, small fumaroles were recognized clearly, and the temperatures of high fumaroles measured but with many uncertainties related to the not very sophisticated nature of the device itself and the images recorded by the camcorder for the low temperature fumaroles became blurred.
THE OTHER VOLCANOES OF THE CASCADES
Some Cascades stratovolcanoes have appreciable hydrothermal alteration, whereas others do not. Significant upper-edifice alteration is exposed on Mounts Rainier and Adams, where multiple clay-rich debris flows have occurred in the Holocene; by contrast the edifice eviscerating, debris-avalanche deposits from Mount St. Helens (1980) and Mount Shasta (Pleistocene; Crandell, 1989) are minimally altered.
A possible explanation for differences in alteration is eruptive style. Volcanoes that produce abundant interlayered lava flows and breccias, and perhaps vent facies breccias, create multiple permeable regions suitable for perched aquifers into which escaping magmatic volatiles can condense (Mounts Rainier, Adams, and Baker), in contrast to volcanoes that extrude dense lava domes and thick lava flows which are cut by through going fractures that allow escape of magmatic volatiles to the atmosphere (Mounts St. Helens, Hood, Shasta, and Lassen Peak).
The upper part of the edifice at Mount Adams erupted in the past 10–40 kyr, with summit-forming andesite lava flows and interlayered breccias erupted at 10–15 kyr BP (Hildreth and Lanphere, 1994).
Venting of H2S from the summit crater and deposition of elemental sulfur beneath the summit ice cap indicates the presence of an active hydrothermal system.
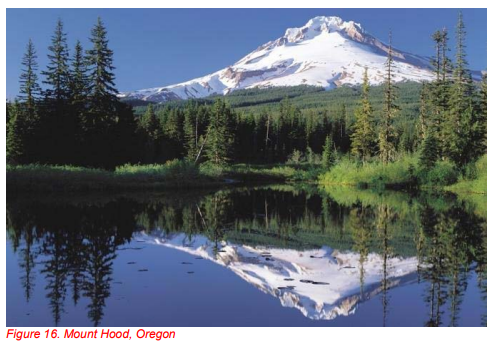
All the consideration made for Mt. Rainier, and Mt St. Helens can be extended to the other Cascade volcanoes. Mt. Hood for example towers on the city of Portland, Oregon at a distance of approx. 35 miles from the city surroundings and undoubtedly poses a serious risk for many people and properties around it. The possibility of applying this system and techniques to Mt. Hood must not be under valuate too at all.
The presence of active fumarole on most of these volcanoes makes the infrared analysis even more suitable.
A combined system of surveillance made of fixed-on the ground thermal imagery stations and drone aerial stations is the best way to obtain significant data and characteristics about the volcano behavior and the next phase of activity.
ANALOGIES WITH VESUVIUS AND PHLEGRAEAN FIELDS
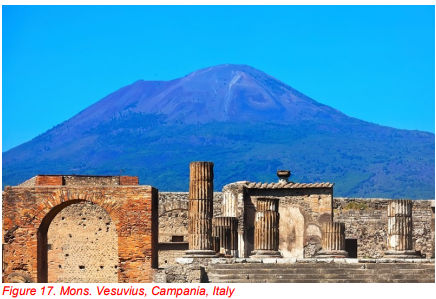
Mount Vesuvius, one of the most famous volcanos in the History, which destroyed the important Rome satellite roman city of Pompeii during the apex of the Roman Empire (79 AD) bursting out all its energy and force over an area of 185 square miles with a VEI index of 5, imposes its classic double tips profile on the bay of the third city of Italy, Naples.
The Somma-Vesuvius is one of the world most dangerous volcanoes, as more than 600,000 people live within 10 km of the crater and the big town of Naples is only 15 km far. It is a stratovolcano consisting of a recent edifice, the Vesuvius Cone, grown within a summit caldera of the older Mt. Somma volcano. The volcano is located at the intersection of NW-SE, and NE-SW trending, oblique-slip faults, and E-W trending normal faults [Bianco et al. 1998, Ventura and Vilardo 1999a].
In the last 22 ka Somma-Vesuvius volcanic activity produced four high-magnitude, plinian eruptions (Pomici di Base, Pomici di Mercato, Pomici di Avellino and A.D. 79 Pompeii eruptions) and almost four subplinian eruptions and intense low-intensity strombolian and effusive activity. In the period between Avellino eruption (3.9 ka B.P.) and A.D. 79 Pompeii eruption at least eight explosive eruptions from subplinian to violent strombolian occurred. After A.D. 79 the activity became more frequent and discontinuous open-conduit strombolian to violent strombolian activity alternated to the A.D. 512, A.D. 472 and 1631 subplinian eruptions. Summit or lateral lava effusions and semi-persistent strombolian activity prevailed in the most recent period (1631–1944) characterized also by several violent strombolian and poly-phased eruptions like the 1906 and 1944 ones [Santacroce 1987, Cioni et al. 1999, Santacroce et al. 2005, Cioni et al. 2008].
So as Mt. Rainier, even Mt. Vesuvius is one of The Decade Volcanoes, a list of 16 volcanoes identified by the International Association of Volcanology and Chemistry of the Earth's Interior (IAVCEI) as being worthy of particular study and attention in light of their history of large, destructive eruptions and proximity to populated areas.
Amongst the most dangerous and controlled volcanoes in the world on which attention is constantly at the highest levels for the risk of an explosive eruption in close times, the Vesuvius’s history is made mainly of explosive activity, pyroclastic flows and surges.
Due to their high viscosity, past lava flows rarely flowed off the cone itself and most remained within the boundaries of the Vesuvius actual park. Lava flows chiefly built the volcano’s edifice and much of the summit cone is composed of lava flows emplaced during the past few thousand years, exactly like the Rainier. There has been a record of small lahars too. Mudflows and lava flows from the eruption in 1631, for example, killed 3,500 people.
Both of them are complex Stratovolcanoes: the first was emplaced where it is now by the 79 DC eruption (by the 472 DC one according to other authors); in any case the Vesuvius typical double pointed shape as we see it today towering the gulf of Naples has been formed inside the remaining of the Mt. Somma caldera, a previous ancient volcano (the proto-Vesuvius) that was supposed to be much higher than the actual height, estimated at about 3000 m on the sea level. Similarly, even Mt. Rainier had a successive cone growth inside the remnant part of the Osceola collapse: the horse shoe shaped summit was slowly filled by lava flows and products of the post-Osceola activity, and today it is possible to admire a sort of double cone crater at the top.
Basically, the major similarities within the systems are the presence of a fumarolic field and the explosive characteristic of both the systems, and this must not be underestimate. The volcanism in the Campi Flegrei area instead has been strongly characterized by two large caldera collapses due to the Campanian Ignimbrite (39 ka) and Neapolitan Yellow Tuff (15 ka) eruptions. The resulting nested caldera has continued to be characterized by active volcanism, which has produced more than 67 eruptions over the last 15 ka [Di Vito et al., 1999; Orsi et al., 2004]. The magmatic system is still very active, as testified by the last low-magnitude intracaldera eruption that occurred in 1538 A.D. (Monte Nuovo [Guidoboni and Ciuccarelli, 2010]), the activity of the fumaroles and hot springs [Chiodini et al., 2001, 2010, 2011, 2012], and the unrest episodes over the last 50 years. These have produced a maximum net ground uplift of about 3.5 m in the Pozzuoli area [Orsi et al., 1999; Troise et al., 2007; Del Gaudio et al., 2010; De Martino et al., 2014]. Each unrest phase has been accompanied by ground deformation, seismic activity, gravity changes, and variations in the discharge rates and gas compositions of the fumaroles [Chiodini et al., 2010, 2012; D’Auria et al., 2011; Troiano et al., 2011].
SUMMARY
In non-eruptive periods, the study of temperature variations in thermally active volcanic areas is essential to detect precursory signals of volcanic unrest. Routine thermal surveys by portable, fixed or satellite imagers can help understanding long-term temporal variability of volcanic thermal anomalies, shedding light on small changes in a volcano's regime that would warrant implementation of a more sophisticated monitoring system (e.g., Dehn et al., 2000; Galingo et al., 2008). The methodologies applied by volcano observatories for monitoring of volcanic activity include searching for variations in the thermal pattern of volcanic features such as active fumaroles, hydrothermal systems, and open vents and fractures (Flynn et al.,2001).
Originally the Thermal surveys of Volcanoes started with from Spaceborne Remote sensing-based observation with programs like ASTER or Modis but with a moderate and coarse-resolution sensor such as 90-m pixel for the first or sensors 1-km pixels such as AVHRR or MODIS.
The advantage of having a system interconnected and controllable by an operator of ground-based and aerial surveys is that data are acquired on a regular basis and a time series can be established. The most recent thermal cameras and drone-associate available on the market open new perspectives on the use of this system in order to gather the best quality possible for the thermographic analysis.
A very good example of surveillance and long series automated system and one of the most active suitable examples is still active in the Campania Region Volcanic District in Southern Italy formed by the two different as well as known and dangerous volcanoes of Mt. Vesuvius and the Phlegraean Fields caldera. This project called TiimNET(Thermal Infrared Imaging NETwork), is made of three stations located, respectively, at Vesuvius crater(ICARUS), inside the Solfatara crater and at Pisciarelli fumarole field and is planned for continuous, long-term volcanological monitoring by acquiring daily infrared images (LWIR in the range 8-14 µm) and monitored by INGV-Osservatorio Vesuviano. The results acquired by this network were extremely positive and important and compared to other acquired data as seismic activity, geochemical parameters and GPS measurements they showed a perfect correspondence in term of the same trends and behavior of the volcanic systems.
Measuring temperatures of a volcano’s features and especially of fumaroles and other degassing manifestations anywhere is of extreme importance in order to gather any transition in the volcano behavior.
The Cascade Range in the western United States is made of several dangerous and active stratovolcanoes, with Mt. Rainier as leader of it, that deserve a major attention and analysis with thermography. Except few studies made in the past and recent specific surveys operated by helicopter in occasion of a dome resurgence eruption in 2004 of Mt. St. Helens, there has not been any real long term and constant data analysis of the thermal features of these Volcanoes.
Beginning with the tracking of the most obvious volcanic processes such as explosive and effusive events, thermal imagery has allowed the study of the evolution of fracture fields (provided that fractures are paths for hot gas leakage), lava lakes, obstructed summit craters, fumarole fields, and lava domes. Whereas in the past, infrequent direct surveys might be carried out using thermocouples or radiometers, the adaptation and development of remote sensing instruments for observing thermal volcanic activities now offers tremendous opportunities for gathering systematic, high-spatial resolution data. This represents a substantial contribution to volcano surveillance and hazard assessment.
REFERENCES
ANALYSIS OF TEMPERATURE TIME SERIES FROM THERMAL IR CONTINUOUS MONITORING NETWORK (TIIMNET) AT CAMPI FLEGREI CALDERA IN THE PERIOD 2004-2011. F. Sansivero, G. Vilardo, P. De Martino, G. Chiodini
Istituto Nazionale di Geofisica e Vulcanologia - Osservatorio Vesuviano, Naples, Italy
LONG-TERM TIR IMAGERY PROCESSING FOR SPATIOTEMPORAL MONITORING OF SURFACE THERMAL FEATURES IN VOLCANIC ENVIRONMENT: A CASE STUDY IN THE CAMPI FLEGREI (SOUTHERN ITALY).
- Vilardo, F. Sansivero, and G. Chiodini
Istituto Nazionale di Geofisica e Vulcanologia - Osservatorio Vesuviano, Naples, Italy
THE AUTOMATED INFRARED THERMAL IMAGING SYSTEM FOR THE CONTINUOUS LONG-TERM MONITORING OF THE SURFACE TEMPERATURE OF THE VESUVIUS CRATER. Fabio Sansivero, Giovanni Scarpato, Giuseppe Vilardo
THERMAL MONITORING OF HYDROTHERMAL ACTIVITY BY PERMANENT INFRARED AUTOMATIC STATIONS: RESULTS OBTAINED AT SOLFATARA DI POZZUOLI, CAMPI FLEGREI (ITALY) G. Chiodini, G. Vilardo,V. Augusti, D. Granieri, S. Caliro, C. Minopoli, and C. Terranova. Istituto Nazionale di Geofisica e Vulcanologia - Osservatorio Vesuviano, Naples, Italy
VOLCANO SURVEILLANCE USING INFRARED CAMERAS
Letizia Spampinato ab, Sonia Calvari a, Clive Oppenheimer b, Enzo Boschi c
- Istituto Nazionale di Geofisica e Vulcanologia, sezione di Catania, Piazza Roma 2, 95123, Catania, Italy
- Department of Geography, University of Cambridge, Downing Place, Cambridge CB2 3EN, UK c. Istituto Nazionale di Geofisica e Vulcanologia, sezione Roma 1, Via di Vigna Murata 605, 00143, Roma, Italy
USE OF THERMAL INFRARED IMAGING FOR MONITORING RENEWED DOME GROWTH AT MOUNT ST. HELENS, 2004
U.S. Geological Survey Professional Paper n.1750
David J. Schneider, James W. Vallance, Rick L. Wessels1, Matthew Logan, and Michael S. Ramsey
ROADSIDE GEOLOGY OF MOUNT RAINIER NATIONAL PARK AND VICINITY by Patrick T. Pringle
Washington Division of Geology and Earth Resources
Information Circular 107, June 2008
INFRARED THERMOGRAPHY OF THE FUMAROLE AREA IN THE ACTIVE CRATER OF THE ASO VOLCANO, JAPAN, USING A CONSUMER DIGITAL CAMERA.
Furukawa Y.; 2010 J. of Asian Earth Sciences 38 (2010) 283–288
MONITORING WINTER ICE CONDITIONS USING THERMAL IMAGING CAMERAS EQUIPPED WITH INFRARED MICROBOLOMETER SENSORS.
Janet Lightaa*, Subashini Parthasarathyb, William McIverca, University of New Brunswick (Saint John), Saint John, E2L4L5, Canada
ACKNOWLEDGEMENTS
I would like to thank in a special way my two “mentors” at the Osservatorio Vesuviano (Vesuvian Observatory)- INGV Naples section, Fabio Sansivero and Giuseppe Vilardo. And all the staff of FLIR and other dedicated professionals that makes even these types of researches possible.
ABOUT THE AUTHOR
Daniele D'Accardi is a young geologist specialized in Thermal imagery science applied to Volcanology. He collaborated with a major project of Thermal surveillance of The Phlegraean Fields and Vesuvius Mons in the Campanian Area in Naples Italy. His aim is to give a substantial contribution to the current and already in use application of Thermography to Science and in particular to the Geosciences for reasons of Public Utility and to the development of new techniques in this field on the territory of the United States.