Thermal Imaging as a Development Tool for Super Efficient House Design
InfraMation 2009 Application Paper Submission
Graham V. Walford
Walford Technologies, Inc./StrataG, LLC
Kathryn P. Cogar
Oak Ridge National Laboratory
Jaret J. Frafjord
B&W Y12
ABSTRACT
A new house structure has been designed and constructed that utilizes both below ground thermal mass combined with prevailing ambient conditions to help balance a consistent quality living space. The house below ground thermal performance depends upon thermal connectivity through the foundations and a below ground thermal heat exchanger. Other concrete parts, notably the slabs, are thermally isolated from the ground. Thermal imaging analysis has proven to be a significant tool in aiding our understanding of the house design and performance. For this house structure, termed the “Reality House”, energy efficiency, air and light quality, water, water management, environmental quality, one level living space, cost, cost of operations, maintenance and repair and longevity of the structure have also been considered. A study of the structure’s thermal images, another home and some ground level detailing, reveal heat transport mechanisms. When combined with other sensors, these help identify heat transport through foundations, roofing, and through the below ground air heat exchange system into the house. Multiple embedded sensors both below ground level and throughout the house have been used to provide additional thermal profiling under a variety of conditions. The air-thermal mass heat exchanger system (not to be confused with geothermal heat pumps) provides up to 3 tons (see Appendix) of air conditioning into the house with a power consumption of only 90 watts.
Analyses are briefly presented to show thermal performances, how these are identified from the support and image data, and then how these can aid future residential and commercial designs.
This house is termed “Reality House” in that it is targeted to deal with the realities of life. We are planning to develop similar buildings and apply their technologies to support residential and small commercial spaces, atriums, greenhouses, and garage/warehouse type buildings.
INTRODUCTION
High efficiency building discussion is topical and it is an issue of great significance. However, the needs are significantly beyond the typical interests of saving energy and money and “being green”. The “Reality House” is targeted to a broader and more fundamental view where human and environmental needs are interlocked. Common adoption of this engineering is of consequence to USA strategic needs, grid supply needs, community, individual independence, and preservation of our environment. Optimal building longevity and flexibility of use is also necessary and desirable. While this initial building is residential, its technology is more broadly applicable. To aid in this effort the following two classifications of space are considered:
- Critical Space: This is space where both temperature and humidity control is required within a limited temperature range say 72 ºF ± 5 ºF and relative humidity 45% ± 10%. This includes homes, offices, laboratories, medical centers, etc.
- Sub-Critical Space: This is space where a broader range of temperature and relative humidity do not restrict the use of that space. For example, a temperature range may be acceptable from 45 ºF to 80 ºF and relative humidity may range from 25% through 75%. This includes atria, greenhouses and garage/warehouse type buildings.
There is a large amount of information available on web sites, etc., but in terms of solving an end use need and finding contractors who will build cost effectively to ones need is frequently difficult. Often there is little comparative building data to help buyers properly determine financial and operational returns.
The construction of the house discussed in this paper (better termed a critical space building) is targeted to meet several intertwined demands of which thermal performance is one. Thermal performance is partially assessed through the use of implanted sensors and through the use of thermal imaging. As is well known, the use of thermal imaging can provide a combination of construction, moisture transport, and thermal performance information which are all important.
This house design was based upon a combination of its targeted needs and selected materials. Expanded polystyrene (EPS) was used for insulation and as “geo-foams” and was tested in our laboratory for mechanical and chemical properties to satisfy longevity issues. Where practical, concrete usage through Insulated Concrete Forms (ICF) and slabs, was implemented Alternative building structures are viable, such as Structural Insulated Panels (SIPS) that meet the thermal needs of that building. However, SIPS panels will not facilitate ground thermal transport for wall cooling or heating.
This building has been in operation for approximately six months. Measurements and analyses were made during construction and analysis continues through its operation.
HOUSE CONCEPTS
Figure 1 shows schematic diagrams of the house and its primary features. This structure could equally well serve for other critical space needs. Two ground thermal mass heat exchangers (GTMS) have been built and installed. Incoming air is drawn through a GTMS to eliminate the temperature extremes from winter and summer ambient conditions. These GTMS systems are shown as recycling systems, although a combination of recycle and fresh air inlet is also practical. Effort is made to balance the whole house’s internal temperature utilizing ground thermal mass temperature (typically ranging 45-60 ºF) and external temperatures (typically ranging 10 ºF to 105 ºF), both depending upon season, time and latitude. This temperature will vary somewhat according to latitude and season, but never according to time of day. Supplemental air conditioning is periodically required, although much less than equivalent buildings without GTMS. This building is located in Tennessee, but such an approach is viable at all latitudes of the USA. Ground thermal mass temperature classically provides cooling and is the basis of cool storage, root cellars, etc. yet is almost never exploited in any current USA house construction. These systems will also warm incoming air when the ambient external temperature falls below 55 ºF.
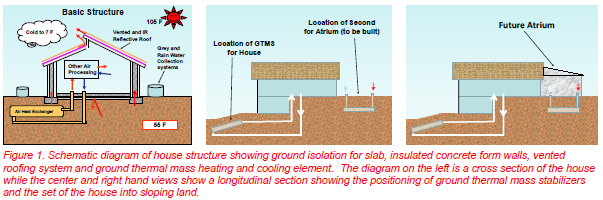
Daytime air temperatures can range up to 60 ºF in a 24 hour period. This critical space house has been designed to attempt a balance between the more stable ground temperature and the more variable ambient temperature. The structure main floor is defined as one floor living and the lower level as a separate space or study/studio. The approach for the structure thermal stabilization is to minimize ambient temperature extremes through good wall and roof design (rather obvious), utilize ground cooling/warming of the walls through ground connectivity through the foundations (somewhat obvious), thermally decouple the floor slabs (less obvious) so that the slabs
approach internal ambient temperatures, and utilize a GTM system heat exchanger to pre cool/heat air entry into the building (not obvious). As described above the GTM system utilizes an air moving assembly (fans) to transport air through a heat exchanger and into the building volume. In high summer conditions, air is cooled and in winter time, air is raised to ground temperature (typically 55 ºF) and then heated.
This construction has three phases as follows:
Phase 1: Build the house structure utilizing specific design, materials and two ground thermal mass systems. Learn the house performance its power needs, etc., before any solar photovoltaic, solar hot water heater generation or other generation equipment is added.
Phase 2: Build and attach an atrium/greenhouse utilizing only the GTM system for heating and cooling (sub-critical space).
Phase 3: Build and attach a garage/warehouse space with GTMS (sub-critical space). Learn the behavior of all three elements
Phase 1 has been completed and the building is now is now occupied. Seventy four temperature and moisture sensors have been implanted ranging from below ground to throughout the roofing structure locations. Thermal imaging was also performed on some key elements of the structure and also compared with a second structure (mobile home) also built on site. The GTM system for Phase 2 has been installed and ready to receive the sub critical atrium structure. At this time, phase 3 is scheduled for 2010.
It has been an important part of the project to work with traditional contractors so that learned innovations can be readily implemented for their future construction or remodeling efforts. In consequence while the building offers excellent performance, some parts are less than perfect, but serve as examples for improvement in subsequent constructions.
UNDERSTANDING GROUND THERMAL ENERGY POTENTIAL
Most current housing needs, to this point, have been addressed through appearance of the space created with builder priorities set by profit, minimization of construction cost, short term use (average home occupancy in the USA is 6.8 years with house average lifetime only 52 years) and rapid delivery of an end product. Energy effectiveness and building longevity have been lesser priorities. In consequence, use of ground thermal mass and balance with other land features are often neglected.
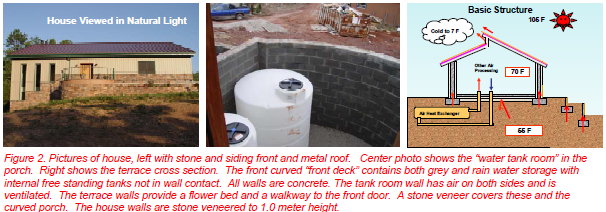
Figure 2 shows photographs and a sketch of the house front where a curved porch wall contains free standing waters tanks. The center photograph shows the water curved wall and water tanks during construction. The house is oriented with an east-west ridge line on sloping land with easterly and northern down slopes.
A FLIR Model 325 thermal imaging camera was used to thermally image parts of the house structure. Figure 3 shows thermal images of the house front, essentially matching the left photograph in Figure 2. These thermal images were taken early morning with outside temperature at 32 ºF and internal house temperature set to 70 ºF.
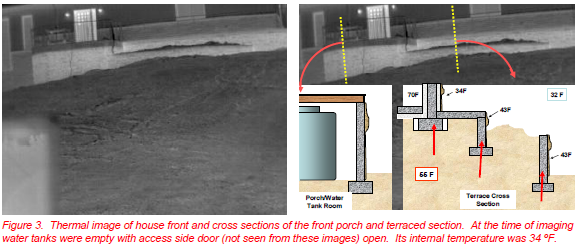
The original objectives for acquiring these images was more conventional; ie. to identify leaks and other factors concerning any structural defects that should be remedied. As is obviously seen, the front door is clearly defined and a warmer band is also identified under the eave, due to a construction issue discussed later in this text.
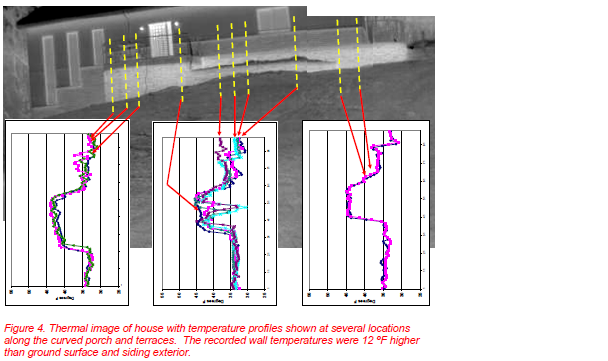
The image was analyzed and temperature profiles were taken along line profiles as identified in Figure 4. These data were generated through a combination of FLIR Software and Image Pro analytic package. It is clear that the terrace and porch walls are significantly warmer than the ground surface temperature of approximately 32 ºF. It is significant that both wall structures have similar temperatures at 43-44 ºF. The internal porch space temperature was 34 ºF as measured by the empty water tanks. Evaluation of other temperature sensors previously implanted below ground implies that the wall temperature is due to ground connectivity approximately 24” below the surface. The stone veneer on the main house front is approximately 2.0” thick and is secured via a standard steel mesh which is secured to the insulating EPS backing. This has a low temperature approximately 3 ºF above the ambient of 32 ºF. Bearing in mind its low mass when compared with the concrete walls, it is reasonable that this would cool to this temperature overnight. It is reasonable to conclude the retaining concrete walls exhibit higher temperatures because of their connectivity to the ground thermal mass.
Figure 5 shows images of the corner of a mobile home located approximately 150 ft from the Reality House in very similar ambient settings. This is shown both as a photograph and a thermal image taken within a few minutes of the house thermal images. Again, these images were taken with the initial intent of distinguishing the mobile home construction from that of the Reality House. However, the images subsequently demonstrate that the ground temperatures observed are of considerable interest and of more importance. As with many mobile homes, it is raised on cinderblocks with a protective vinyl skirt.
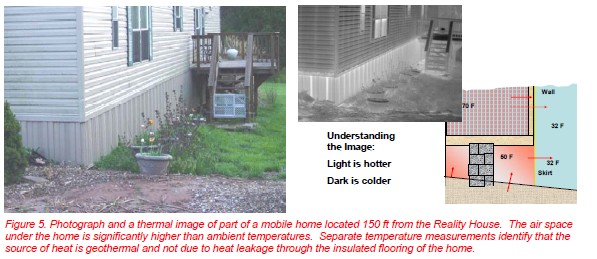
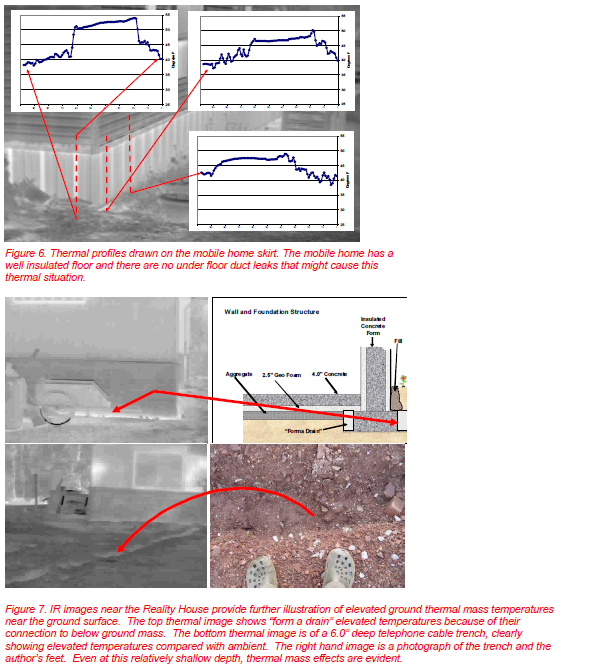
Figure 6 shows three thermal line profiles made on the skirt thermal image. One of these is “drawn” in the “niche” of the skirting which appears warmer than the other two lines drawn on flat exposed surfaces. These show temperatures comparable with the temperatures shown in Figure 4. These images likewise imply usable thermal mass below buildings that may be utilized.
Figure 7 shows images taken during construction and a diagram which could be easily ignored. The top thermal image was taken to observe any issues that there may have been with siding or other construction activity. Of significance is that the “Forma Drain” top has a significantly elevated temperature compared with the soil surface temperature. The drain is an air filled form for foundation forming that remains in place after the concrete pour to provide permanent drainage and gas venting. This drain also will take the same temperature as the concrete and thereby the ground mass at that local depth. This image was taken prior to back fill around this outside wall. This image is probably technically insignificant except from the point of illustration of the ground mass elevated temperatures. The lower IR image of Figure 7 also shows a small trench cut approximately 6.0” depth at the time of imaging to complete the telephone cable connection. Even at this shallow depth, as evidenced by the photograph on the right, a 4 ºF temperature differential prevails between the trench top and its bottom.
The data and observations made in figures 3 through 7 were obtained “inadvertently” as the primary target was observation of the Reality House itself. However, the importance lies in the visualization of the thermal mass and its elevated temperatures (at least for cool weather observation). Future building engineering would benefit from the exploitation of this neglected thermal source.
SOME FLOOR OBSERVATIONS
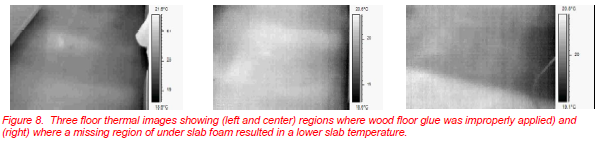
Thermal observation of objects must be undertaken with care to ensure the structure of interest is being properly analyzed. In this house, the concrete slabs were thermally insulated from the ground and aggregate filling with the use of 2.5 inch EPS foam. Figure 8 shows a diagram of this slab isolation detail. Final floor finish was a laminated wood flooring 0.5 inch thickness glued directly to the floor. For experimental reasons, as well reasons of error, small portions of the foam were omitted at certain locations in the house flooring. It is important to understand if under slab foam installation is beneficial. Figure 8 shows three thermal images of the floor at different locations in the house. These images were obtained observing ambient temperatures and without the use of other heating sources. The house internal temperature was 70 ºF and external temperature 32 ºF. The under slab temperature was measured as 55 ºF through the use of implanted thermistors separately measured. For the locations at the left and center images shown in Figure 8, it was known that EPS foam had been installed. Examination of these regions showed improperly applied glue so that the flooring has separated from the concrete at these regions. This is sufficient to explain the higher temperature regions observed in the images. For the right hand image, the flooring was properly glued and in good concrete contact. This is also a region where under slab foam is absent. This image shows a clear delineation between the foam and no foam boundary where the darker (colder) region is that without foam. These images imply that under slab insulation is desirable and that wood flooring installers should have been more thorough in their work.
SOME STRUCTURE OBSERVATIONS
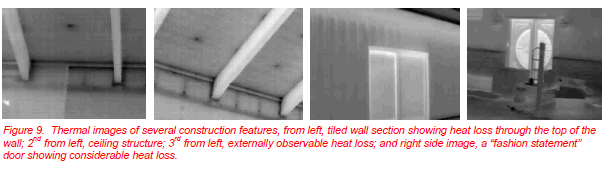
In general, the Reality House discussed in this paper was well constructed. Several features were experimental which also provides opportunity to develop improved future building structures. Figure 9 shows some brief examples of thermal leakage that are typical, but avoidable for future construction. In the two left images, the insulated concrete wall (total 5.5 inches EPS and 6.0” concrete) was not completely filled. The builder remedied this issue utilizing a 2” by 6” wood construction filled with EPS between the ceiling joists. The roofing (discussed in the next section) is a “cathedral” ceiling. The external temperature was 32 ºF and the internal temperature was 70 ºF. The left image was taken for a part of the wall that was additionally coated with floor to ceiling ceramic tile as a kitchen area. Even through the tile, the heat path through the wood to the exterior is clearly observable. The third thermal image is of the outside wall at this same location. The increased temperature region shown is exactly consistent with the region imaged from the inside of the house.
Additional observation of the two left hand images reveals dark spots on the ceiling images. These are because of long securing screws necessary in the roofing structure to meet county building codes. The total heat loss through these points is small.
The right hand image of Figure 9 shows a double back door of the house, imaged from the outside. Again, internal temperature was 70 ºF with outside temperature being 32 ºF. This door is not well insulated and can be viewed as a “fashion statement”. At this location a future atrium is planned that would also act as an air lock into the house and so mitigate the thermal loss of efficiency resulting from this design factor.
ROOFING OBSERVATIONS
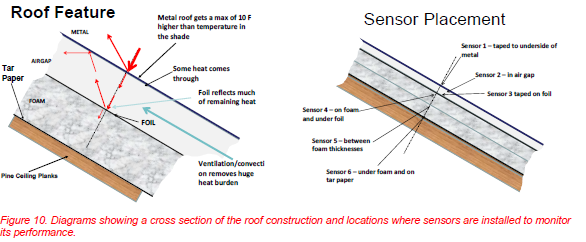
The roof design and construction is a major feature of the house. This was aided with input from Edward Grant and Robert Butkus3 and also from information available from the Oak Ridge National Laboratory (ORNL)4 web site. Figure 10 shows cross sections of the roofing structure. At various locations and levels in the roof, numbers of temperature sensors were installed to allow monitoring of the roof under varying conditions. Metal roofing is employed that is coated with infrared reflecting pigments. This results in a significant reflection of the infrared component of the sun’s incident energy spectrum with consequential reduction of heat loading. A venting location is provided under the metal 2.5” thick. A second infrared reflective barrier is provided of aluminized foil. A six inch thickness of EPS foam is then installed, laid on the pine plank ceiling on tar paper. The whole is supported with large wood rafters as a visible ceiling feature. All air ducts in the house are therefore installed in conditioned space.
The roof comprises two main components. The first component comprises the two infrared reflective barriers and air gap to vent captured heat. This provides a combination of radiative and convective protection. The second component is the EPS insulation layer which provides thermal insulation. The use of metal provides longevity and has a low thermal mass to aid in reduction of heating excess mass.
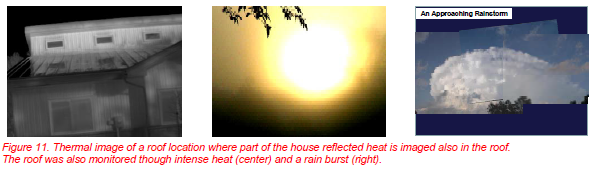
Figure 11 shows one thermal image of the house roof. The image of the roof is mostly obscured through observation of a reflected heat image from the vertical heat section. The image is dark (cold) for the remaining roof in the image. This is not a quantifiable image, but it serves to underline the very high thermal reflectivity of the roof which underlines its ability to minimize roof structure thermal loading.
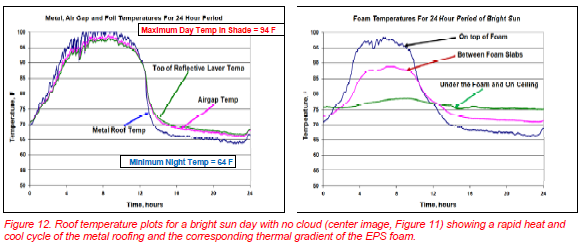
Using the implanted temperature sensors, the roof has been monitored for thermal performance over seasons and day to day. Two examples are now discussed. A data acquisition computer is set to record the temperature of each of the implanted sensors every 10 seconds. For this example, a sensor set was observed as selected in Figure 10, where three sensors monitor the reflecting and vented portion and three monitor the foam insulation portion temperatures. For each of these tests and examples, internal house air conditioning of any kind was turned off. The temperature profiles were collected for a 24 hour period commencing 6:30 AM.
Figure 12 shows the recorded temperature plots for each roof portion. The internal temperature raised 3 ºF in the ceiling. It is important to note that the metal roofing was no higher than 10 ºF above shade temperature. A dark asphalt roof tile roof in the vicinity approached a surface temperature of 130 ºF.
It is of particular importance to note the rapid fall in temperature of the roof once direct sunlight is not present. This is because of a combination of heat reflection and low thermal mass of the metal. The right hand graph of Figure 12 also shows the thermal lag time of heat transfer through to the ceiling.
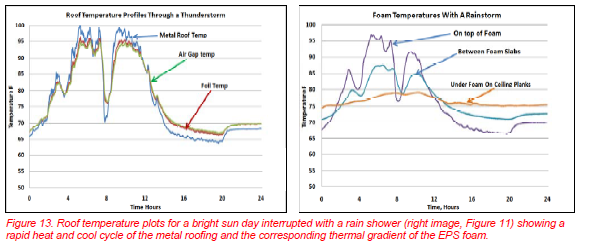
Figure 13 shows a second 24 hour period recorded where the day started as bright sunshine, but was subsequently interrupted with a strong rain storm (Figure 11). The temperature drop caused by the rain is significant as it dropped 25 ºF, but also in the rate of change of the temperature. This further underlines the ability of the roof to rapidly shed excess heat. Such a feature is highly desirable, but it must also be built on a well insulated roof for winter periods.
In summary, this roof structure represents an optimal construction that might be further improved for future developments only with thicker EPS.
HOUSE GTMS AND PERFORMANCE
This house has many significant features, but is dominated by its roofing structure (previous section) and it’s Ground Thermal Mass Systems (GTMS) for temperature stabilizing. With the two systems installed, one is for main house temperature stabilization and one for a future atrium. Both are built external to the building which also implies that such GTMS could be added to existing buildings. These could also have been built and installed under the house.
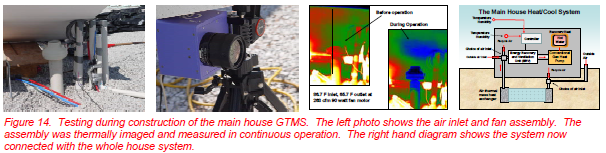
For the GTMS built for the house, a test was performed during construction. Figure 14 shows a part of this test. The fan assembly was installed on the inlet pipe and turned on. Inlet and outlet temperatures were measured and the system was set to operate continuously. A board was placed to impact inlet air (Fig. 14, left photograph). A thermal camera was used to view the fan and board and implanted temperature sensors were used to plot temperature. At 263 cubic feet per minute of air, the system cooled air from 86.7 ºF to 65.7 ºF. The fan motor consumed 90 watts at 110 VAC. Due to the of the nature of the construction site, this test had to be stopped after a few days for construction to resume. It is interesting to note that the camera, DAQ computer, and fan motor were all operating on one 6 outlet power strip. This system is now coupled to the main house system which utilizes a back up geothermal heat pump and energy recovery ventilator to mix incoming air with GTMS air (right diagram in Figure 14) and is in continuous operation.
ATRIUM GTMS AND PERFORMANCE
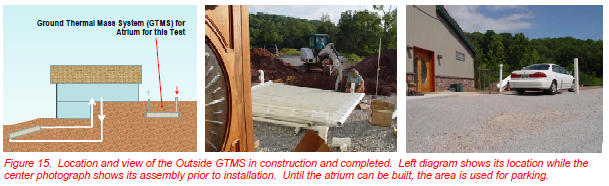
The atrium GTMS is built outside the house back door as shown in Figure 15. The atrium is yet to be built, but at this moment the area serves as a parking space.
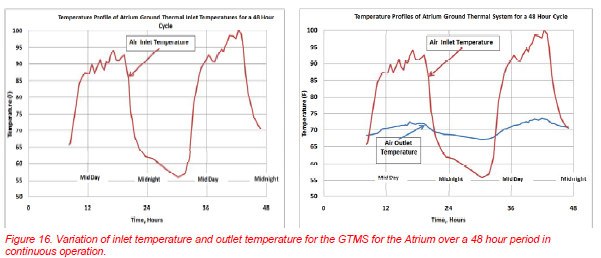
To illustrate the performance of this GTMS, 48 hours of data were collected and plotted in Figure 15. Approximately 200 cfm (cubic feet per minute) of air was drawn through while the inlet and outlet temperatures were monitored. Figure 16 shows that for the two consecutive days over which this data was collected, that while the inlet air temperature ranged 56 ºF to 98 ºF the outlet air temperature range was 67.5 ºF to 73.5 ºF. This included overnight where the ground thermal mass was warming the inlet air, as opposed to cooling it in high sun. Such a temperature regulation discharged into the atrium, when built, will certainly prevent its freezing in winter and experiencing extreme heat in the summer. This is the basis of the GTMS value for sub critical air temperature stabilization.
SUMMARY OF RESULTS AND NEXT STEPS
As discussed, this house building project represents an engineering development where the historic use of ground temperatures has been revitalized and incorporated into a state of the art building envelope. The use of thermal imaging has been significant, both to show certain structural performance and to illustrate opportunities of coupling to the ground thermal mass.
This house is now occupied and there are plans to continuously operate and monitor its performance. Developments are planned to improve the structure design and engineer further buildings. For this work, the greater value obtained from thermal imaging was in examining the apparently small detail in images that show the presence of ground thermal energy. This is not to diminish the more classic use of thermal imaging in understanding temperature, construction and moisture transport. It is planned to continue using thermal imaging techniques, other temperature sensors, and moisture and humidity measurements to track building performance.
REFERENCES
- The Oak Ridge National Laboratory Building Center, www.ornl.gov
- Walford, Graham V., Frajford Jaret, J and Dekanvich, Steven P., “Use of Infrared Imaging Techniques to Understand and Quantify Expanded Polymer Molding Operations and Part Quality”; Proc. InfraMation; 2008 -076
- Grant, Edward, and Butkus Robert, Atlas Roofing/Falcon Foam, 2005-2009 Private Communication
- The Oak Ridge National Laboratory Zero Energy Home Program
APPENDIX
For those not in the air conditioning business, there is frequent confusion about what a “ton” of refrigeration is. One ton of refrigeration will freeze 2,000 pound of water at 32 ºF into ice at 32 ºF in 24 hours. The latent heat (heat of fusion) for water is 144 BTU/lb. So, it takes 144 X 2,000 = 28,800 BTU to freeze this amount of water in 24 hours. This amounts to 12,000 BTU per hour or 3517 watts. One may wonder how we can get 3 tons (10,551 watts) of cooling by using only 90 watts of power. It is because the power consumed is just to move the energy from one place to another, hence the term “heat exchanger”. The cool energy is already there, we just have to devise a way to get it into the home.
ACKNOWLEDGEMENTS
The authors wish to acknowledge the following:
FLIR for the use of the thermal imaging camera equipment.
Atlas Roofing/Falcon Foam for provision of various polymer materials and expertise.
Roane County codes enforcement personnel for input and advice through the entire building project
ABOUT THE AUTHORS
Graham V. Walford is a radiation and nuclear physicist and for the first 15 years of his career was involved in developing radiation and building sensors and the engineering of radiation based measurement systems. Dr. Walford has since expanded his activities to industrial process measurements and control, built upon his initial systems engineering. His industrial developments have included the use of X-ray, sonic, dielectric and resistive infrared and thermal imaging techniques applied in pulping and paper, other forest products and expanded polymer manufacturing facilities and support this engineering development
Ms. Kathryn Cogar is a partner and owner of the design, development and engineering of this house. She has made significant contribution to the needs and requirement specifications of the Reality House
Jaret J. Frafjord has many years experience in diagnostic measurements and analysis and operates the Electron Microscope Facility together with multiple additional diagnostic activities. He and his colleagues have developed and operated their laboratory as a user facility for B&W Y12 DOE during the materials development phase of this project.