IR Air Visualization Tool for Energy Assessment of Kitchen Ventilation Hoods
InfraMation 2015 Application Paper Submission
Caitlyn Clark, Robert Choate, Jimmy Sandusky
Western Kentucky University, Western Kentucky University, Halton Company
ABSTRACT
This paper details the creation of a tool which utilizes infrared technology to correlate different temperature regions to various air velocities. The platform developed will be used with Halton Company’s kitchen ventilation hoods to determine the energy efficiency of their systems. This tool will allow for a more in depth analysis of the minimum amount of energy required to successfully ventilate a conditioned space.
INTRODUCTION
Recently, energy efficiency has become a well-known buzz phrase within our society. People are increasingly aware of the amount of energy they consume and the foot print they leave behind. This has pushed engineers to create new and innovative solutions which improve energy efficiency.
As an individual consumer, however, it cabe difficult to affect (reduce) how energy is used within the commercial sector. Often it is left up to companies to ensure that their products and services are provided in the most energy efficient way possible. Halton Company, a manufacturer of commercial kitchen ventilation systems, has made a commitment to ensuring that their products are as energy efficient as possible.
Within a restaurant setting, kitchen ventilation systems can consume up to 21% of the total energy used. This statistic makes them an ideal target for improving their energy consumption and reducing overall energy usage. Changes can be made to the overall design of the hood but decreasing the required airflow of the exhaust fan results in greatest reduction of energy.
Within the commercial kitchen hood arena tests are conducted to ensure that unclean air – air which contains smoke, grease particles, or other debris – does not escape into conditioned spaces. Along with debris, it is important that the hood prevents the escape of unwanted heat that is being produced by the appliance below it. Unlike debris which can be visually detected, heat cannot.
This being the case, Halton Company commissioned research to develop a tool which could visually determine if unwanted heat was being captured by their systems. This system would also be used to detect the minimum velocity of the exhaust fan required to accomplish this task. Knowing the exact amount necessary to ensure a conditioned space allows for a reduction in energy consumption.
INFRARED THERMOGRAPHY TRAINING
As every budding thermographer knows, it is important to understand the science behind infrared technology. This fundamental understanding allows for a thorough analysis of the thermograms captured. In order to gain this knowledge, training through the Infrared Training Center (ITC) was completed.
Concepts that were taught included topics such as emissivity, apparent temperature, and the fundamentals of heat transfer. The training also created the opportunity for exposure to applications and situations when IR imaging would be beneficial. These simulated situations allowed for exposure to thermography before ever holding an infrared camera.
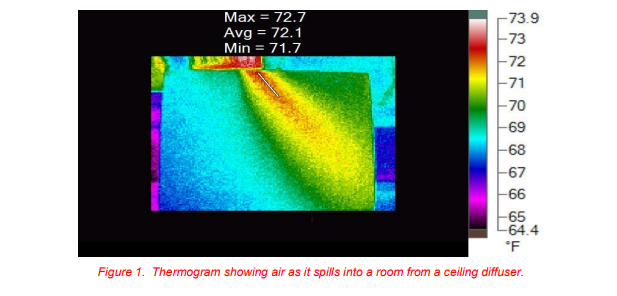
In order to gain experience, and put the training to use, practice thermograms were shot and analyzed in order to ensure a working knowledge of the technology. It was during this time that the image (Figure 1) was taken. This photograph captures a ceiling diffuser distributing air into a room. From the photograph, it can be seen that the air that was escaping from the diffuser was approximately 72˚F (22.2˚C) while the surrounding ambient temperature was approximately 67˚F (19.4˚C). These temperatures are appropriate given that the image was captured in mid-January. The temperature of the air was determined by placing a poster board under the diffuser and allowing the air to flow across it.
At the conclusion of the Halton project, images similar to Figure 1 will be captured. In this picture it can be seen that the points which had the highest temperatures were also the points which correlated to the highest velocities. Using images such as this one, a relationship can be determined which correlates various temperature regions to air velocities.
REPLICATION OF KITCHEN VENTILATION SYSTEM
Since research was to take place at a university laboratory, accommodations had to be made. Halton’s commercial hoods are sized for industrial applications which make for a challenge when trying to install them in a smaller space. Therefore, it was determined that a small scale hood would be necessary to conduct the required research.
All commercial systems include the hood and also an exhaust fan. Therefore, these two components would have to be replicated within the lab setting. In order to simulate an exhaust fan, an air flow bench was created to simulate the needed flow characteristics. Incorporated within the bench was a MSD. This product, developed by Halton Company, utilizes Pitot tube measurements to determine flow rate. The internal Pitot tube array can be seen below in Figure 2.
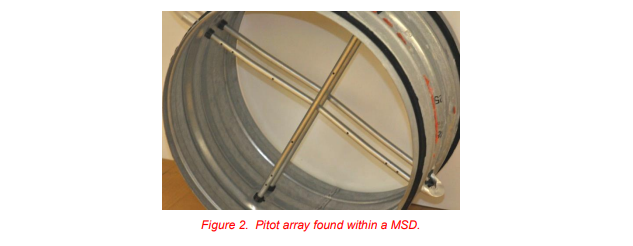
As air travels throughout the flow bench and through the MSD, a differential pressure is created across the array. Through equations characterized by Halton, this differential pressure can be correlated to a volume flow rate. Although this tool is not as accurate as other air flow measuring devices, it is a Halton produced product. Since the final visualization tool being created would be used for Halton, it was decided that the MSD would be an appropriate device to use in the bench.
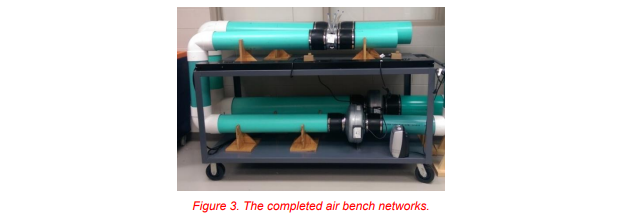
The final design of the air bench relied heavily on the items that were available within the lab. During the construction phase of the project two fans, which had been purchased for a previous research project, were accessible. These two fans - M-6 and M-8 In-Line Duct Booster fan manufactured by Tjernlund Products, Inc. – allowed for both a 6 in (15.2 cm) and 8 in (20.3 cm) diameter ductwork to be created.
Since both fans used within the networks were radial, this produced a flow stream that was circular. Entry length calculations were therefore required to ensure that the flow which was being measured by the MSD had entered the fully developed flow regime. A practical approximation of the required entry length is ten diameters away from the outlet of the fan. Even for the smallest network, 6 in (15.2 cm), this amount of space was not practical within the laboratory. Since MSD’s are generally used in commercial applications, a predetermined length had been calculated by Halton; at least three diameters away from any obstructions. Since this length was much more reasonable, it was the final entry length.
Ductwork for each system was created using 6 in (15.2 cm) and 8 in (20.3 cm) diameter PVC pipe. Each system was constructed around a cart which was also available within the lab. This cart allowed for easy access to both networks and created the ability to move the system once it had been completed. Figure 3, below, shows the final resulting networks.
CHARACTERIZING AND IMPROVING AIR FLOW BENCH DESIGN
After constructing the networks, it was necessary to verify that they could perform to expectations. This verification process involved establishing each system’s impedance curve and comparing a calibrated, true value of volume flow rate to measurements made by the MSD. At the end of this verification process, improvements would be made as necessary until the flow benches obtained the accuracy desired.
In order to derive the network’s impedance curves the minor and major losses within each system needed to be determined. For the completed flow benches, these losses included the obstruction created by the PVC elbows and the lengths of the pipe segments. Because the obstruction caused by the MSD was minimal, it was determined that it could be omitted from these calculations.
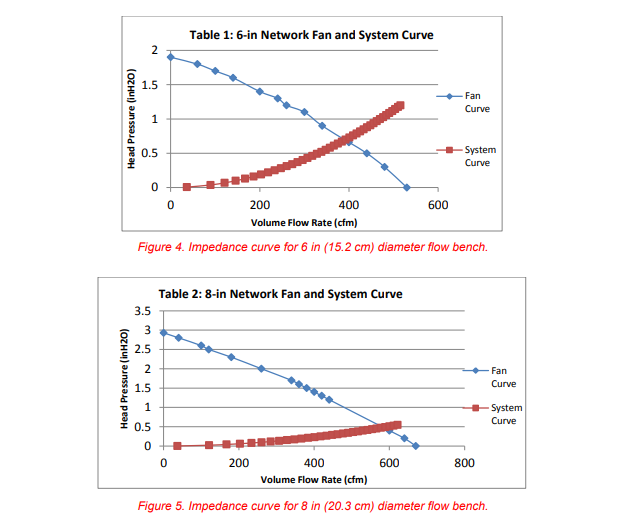
In addition, losses were created within the systems due to velocity and viscous effects of the air. To account for these losses at different velocities, an equation was created and various velocities and correlating volume flow rates were used to populate the curve. This curve was then plotted against fan curve data provided by the manufacturer. Plotting both of these curves together allowed for the operating point of the system to be defined. The resulting plots for the 6 in (15.2 cm) and 8 in (20.3 cm) networks can be seen on the next page in Figures 4 and 5.
After determining the operating point of the systems, work began to understand the networks flow measuring capabilities. To do this, a calibrated hot film anemometer was used as the standard measuring device and measurements were taken across the outlet of both systems. In order to systematically obtain readings, each outlet was divided into an annulus and measurements were taken in specific locations.
A sample set of the data collected can be seen below in Table 1. Since the hot film anemometer takes velocities measurements, each point of data was multiplied by the area of the annulus in which it was located. This created an average volume flow rate for each annulus and the cumulative amount of these averages was compared to the MSD’s produced reading.
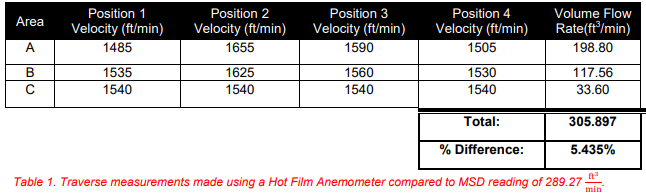
Although the data collected in the sample set seen on the previous page is within an acceptable range percent difference, other data sets exhibited differences as high as 10%. This high of a discrepancy was deemed unacceptable and it was determined that action was necessary to correct this. An air flow straightener was incorporated into each network and allowed to become fully turbulent in a shorter distance. This helped to improve the consistence of the differential pressure created across the MSD and therefore improve its overall measurements.
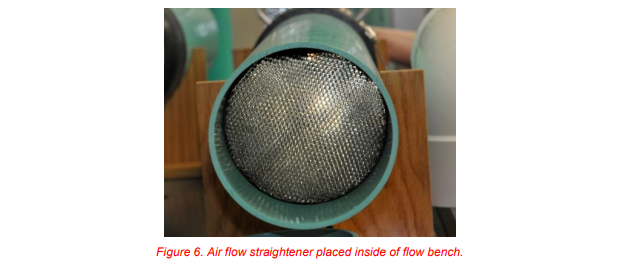
Each air flow straightener was created from plastic, honeycomb material which had been previously used as a filtration material. Sheets of the material were stacked upon each other and alignment of the honeycomb was ensured. Circular pieces were then cut and the sheets were bundled together to create a straightener which complied with The Air Movement and Control Association’s standards. The finished product can be seen below in Figure 6. In this photograph, a backlight has been shone into the end of the air flow bench to better demonstrate the fact that honeycomb structure is concentric.
CURRENT RESULTS AND FUTURE WORK
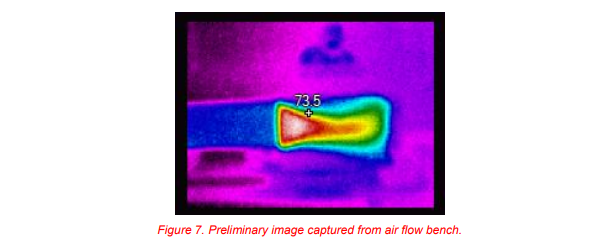
At the time of this paper submission, the finial visualization tool has not been completed, although, preliminary images from the flow benches have been captured. To create a temperature gradient for IR imaging, a small space heater is used to raise the temperature of the air flowing through the flow bench. Like in the image first captured from the ceiling diffuser, Figure 1, the outlet air sprays across a poster board. The captured image can be seen below in Figure 7.
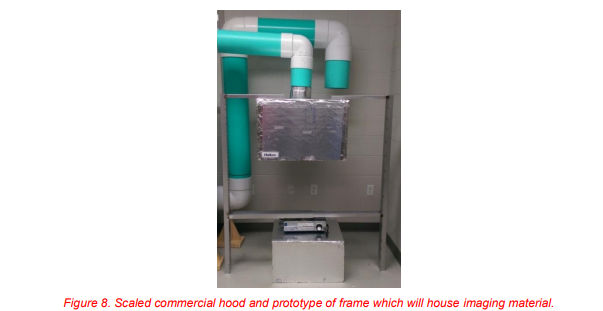
In addition, construction of a scaled model of a kitchen hood has been completed. To successfully model the hood, geometric and dynamic factors had to be taken into account. Details including the height of the hood from the appliance, the height of the appliance from the floor, the amount of overhang the hood had compared to the appliance, and the Reynolds numbers achieved within the system.
Along with creating a scaled model, an initial prototype of the frame which will house the imaging material was created. This prototype along with the scaled hood can be seen in Figure 8. Since the height of each hood is a standard measurement and does not change, the frame was made to that height. This frame only allows for expansion, width-wise, accommodating various lengths of hoods.
Continuation of this research project will begin during the spring 2015 semester at Western Kentucky University. During this time the research will be developed into a senior capstone project, led by the first author of this paper. Next steps within the project include obtaining an imaging material which can withstand the high temperatures, up to 700˚F (371˚C). This high temperature range ensures that no damage will occur to the imaging material when it comes into contact with the various appliances used within commercial kitchens.
After the imaging material has been selected, infrared images of the air flowing in the space between the bottom edge of the hood and the top of the appliance need to be captured. These images will provide a visual way to determine if the contaminated air from the appliance is spilling into the surrounding conditioned space. Using the images captured and heat transfer principles which relate conduction to air velocity, the speed of the exhaust fan used within an application can be determined. These photos will serve as reference for various exhaust air flows. Using the references, Halton will be able to be visually compare the performance of their products to those of their competitors. Thus, allowing them to further prove that they are a leading manufacturer of energy efficient products.
REFERENCES
Parpal, Monica; “Energy-Efficient Hoods in the Commercial Kitchen”;
http://www.foodservicewarehouse.com/education/going-green/energy-efficient-hoods-in-the-commercial kitchen/c28110.aspx;
ACKNOWLEDGEMENTS
The work presented in this manuscript and the experiences gained could not have been possible without the Layne Professorship Foundation, Western Kentucky University’s Engineering Department, the Ogden College of Science and Engineering, Halton Company, ASHRAE, and Professor Robert Choate. All efforts and contributions were greatly appreciated.
ABOUT THE AUTHOR
Caitlyn Clark is a senior in Mechanical Engineering at Western Kentucky University. She is anticipating graduation in May 2015 and hopes to continue her academic career into future graduate studies. She is interested in topics concerning fluid dynamics, specifically the area of aerodynamics. Presently, she works as the thermo-fluids research assistant at WKU where she has completed research funded through a Faculty-Undergraduate Student Engagement grant and by Halton Company. She is also the current president of the Kentucky Gamma chapter of Tau Beta Pi.
Robert Choate is a Professor of Mechanical Engineering at Western Kentucky University. He teaches thermo-fluid and professional component courses, including Thermodynamics, Fluid Mechanics, Systems and Reliability Engineering, Thermo-Fluid Systems Lab and ME Senior Project Design course sequence. Prior to his appointment at WKU, he was a principal engineer for CMAC Design Corporation, designing thermal management solutions for telecommunication, data communication and information technology equipment.
Jimmy Sandusky is the manager of the Research and Development team responsible for new foodservice product development and laboratory testing at Halton Company. Mr. Sandusky is also involved with energy audit services and retrofits – he has conducted energy audits for several commercial kitchens. He currently holds the Secretary Position in ASHRAE committee TC 5.10 Kitchen Ventilation and is a corresponding of SSPC 154 Ventilation for Commercial Cooking Operations. He has a BS in Mechanical Engineering from Western Kentucky University.
Related Articles
-
 Thermography Fundamentals
Know Your Subject Matter
Read the Story -
 Building Science
Three Ways the Pest Professional Can Use Infrared Thermography
Read the Story -
 Electrical/Mechanical
Positive IR Results In the Refining Industry
Read the Story