Normalizing the E-values of Components on a Printed Circuit Board
InfraMation 2009 Application Paper Submission
Rudie Bennett
Saab Avitronics (South Africa)
ABSTRACT
This paper describes the development and application of a method to normalize the emissivity (e-value) of different components on a populated printed circuit board (PCB). This technique is very useful for use on boards and parts of systems if no other thermal images are available for reference. It entails spraying the board with a coating that was tested beforehand and is not harmful to the board. After drying, the board can be powered up slowly until the suspect component or the component suffering from the fault heats up. The coatings used during the development of this technique are commercially available conformal coatings used to protect and seal the printed circuit board against moisture and dust. It is a transparent coating and is approved for professional and military applications.
INTRODUCTION
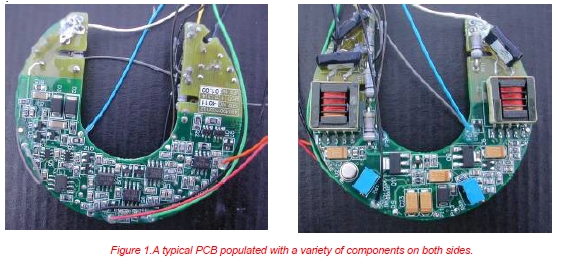
Printed circuit boards (PCBs) are populated with a variety of components manufactured by different manufacturers who apply their own finishes to the components. Figure 1 show a typical PCB populated on both sides. As technology progresses, the density of components increases and a wider variety of components will appear on the scene.
Once the thermal characteristic of a PCB is known, it is easy to do a thermal check on every board that comes off an assembly line. There are numerous thermal test setups with accompanying software available that fulfills the task of checking the thermal image of every board. The bigger the production run, the more cost-effective the setup. Every board that does not conform to the preset thermal image will be rejected and referred for further investigation. For these set-ups, the e-value or the relative temperature of every component under a predetermined condition must be known. This makes it very important that the finish of a component should not vary from PCB to PCB, since setting up the equipment normally takes a long time. Although the component performs according to its specification, the e-value could vary from manufacturer to manufacturer and also from batch to batch.
When it becomes necessary to repair a unit that has been in the field for some time or produced over a long period, it is almost guaranteed that the IR profile will not be the same as the first setup or current production run’s profile. Any post production change to the PCB, whether it is replacing components or just a change in finish, could also make use of a thermal map impossible since the map is based on the image of the original,
healthy board. To complicate the situation, the e-values of components are normally not specified.
This is why it is very difficult to do valid thermal scans on a single board after a long period, especially if it was repaired previously with components from other batches. A further complication is that metal components can have very low emissivities while plastic components can have very high emissivities. Finally, dirt, dust, oils, etc which may coat component surfaces over time can also influence emissivity values.
Under these circumstances, the use of IR scans becomes difficult to interpret. Even a trained thermographer with extensive experience could have difficulty resolving the problem. From a production or repair cost point of-view, it becomes very expensive to use a trained thermographer, since success is not guaranteed. With these facts in mind, a method was derived to simplify the measurements and make IR scanning more cost effective.
DEVELOPING THE METHOD
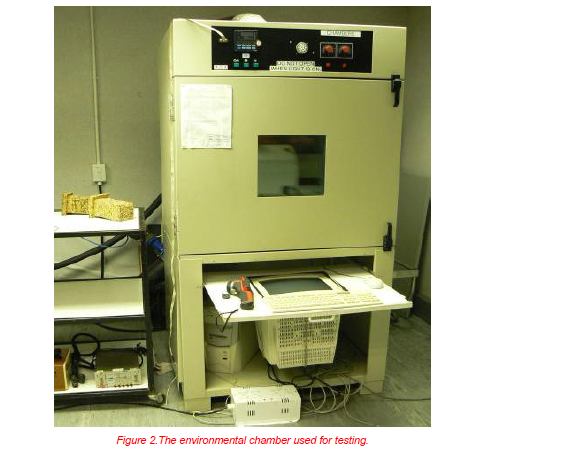
During the development and refining of the method, a large variety of PCBs were used in a controlled environment. Boards were cleaned and then half of the surface masked before spraying. Various coatings all meant for the same purpose were used. After drying, the boards were soaked in an environmental chamber at a certain temperature starting at 10ºC (50ºF). After 4 hours at constant temp, thermograms were taken, and then put back in the chamber, with the temperature raised by 10ºC. This cycle was repeated until the temperature reached 80ºC (176ºF). Figure 2 shows the chamber used for the testing.
One of the first lessons learned from this was that thermography does not work well at temperatures close to ambient temperatures. It was also clear that as long as the thickness of the coating was controlled and the temperature of the sample board was high enough, the results were repeatable.
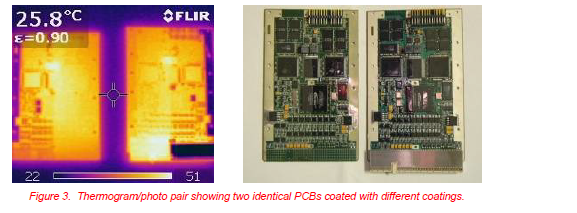
Figure 3 shows a thermogram taken of two similar PCBs masked with 2 different coatings and heated up to 55ºC (131ºF). It can be seen that the e-values of the two coatings are not the same. Although the two boards were at the same temperature, it appears the left hand board is slightly hotter than the other board. Later measurements confirmed that the e-values of the two coatings are 0.8 for the left and 0.73 for the right hand board. Also note the effect of the coating on the metal cover over the connector at the bottom of the right hand board.
METHOD
The following steps were compiled as a guideline for general use. Every thermographer should adapt it to suit his or her own conditions.
- First, ensure that the board is evenly coated with the known coating. This coating should preferably be one of the recognized conformal coatings used for protection of the PCB against moisture and dust. Normally this is done during the production phase of professional and military products.
- Ensure the coating is cured and completely dried out from the solvent and moisture. - Take a thermogram of the cold board. This is only for reference purposes and might not even be used. - Slowly power up the board and keep watching it with the IR camera. As the board heats up the hotter components will start appearing in the image.
- Compare similar type of circuits working under the same conditions.
- To determine the temperature of a specific component, the e-value of the coating used must be known. The reflected apparent temperature (Treflect) must also be known. Properly set Treflect and emissivity values allow direct reading of surface temperatures of components of interest. Ensure not to overheat the board since some components can be damaged at relative low temperatures. Silicon containing components can be damaged at temperatures as low as 125ºC (257ºF)
RESULTS
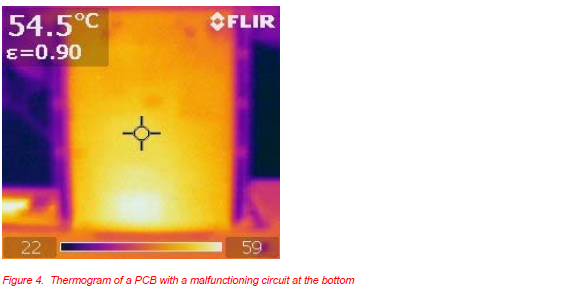
This method proved to be an inexpensive and time-saving with a fairly high success rate. Figure 4 shows a thermogram of one of the instances where the technique was applied to a PCB that did not communicate with the rest of the system. Every circuit on the board seemed to work when the board was tested on its own but in the system it failed. The board was already coated as part of the production process so applying this technique was easy. Shortly after switching on the system, it could be seen that a hot spot appeared at the bottom of the board. Further investigation revealed the four integrated circuit drivers were clocked at a frequency far higher than they could tolerate. After fixing the clock dividers on the master clock the system performed according to specification. The thermogram showed very little definition of the components because the board was thickly coated.
Under certain conditions, the coating helps to reduce the reflection off the board back to the board. Normally this is a handy feature when working on PCBs with some heat sinks or screens and even off the copper tracks of the board itself. At this stage, the physics behind this phenomenon is unknown.
SHORTCOMINGS OF THE TECHNIQUE
When applying this technique, the thermographer should keep in mind that this is not a failsafe method and some level of skill is still required to analyze the image. It will only help finding failures that have a thermal effect on the circuit.
- The person responsible for the electronic testing of the board must be able to test the board in such a way that it shows the problem area before the unit thermally destroys itself.
It is advisable that, if possible, only one portion of the electronic circuit be powered up at a time. This could prevent damage to the whole circuit.
- The test engineer should also know which part of the circuit should run hotter that the other parts. RF circuits are normally much more inefficient than logic circuits and should appear hotter. - Ensure that the coating in use was tested and performs as required.
- Watch out for coatings with exceptionally good thermal conductivity. This causes a loss in definition and could mask the precise position of a small component.
- Ensure the coating was not applied too thickly onto the board, for the same reason mentioned above. It can also blank the hot spot so well that it takes a long time to detect the temperature rise. Be aware that some coatings reflect different than others.
- Some components can be cooled off by the coating and hide the suspect component and create the impression that the fault is not on that particular board. In such a case, the coating was applied too thickly.
- Very thin boards could be warmed up from the reverse side of the board, creating the wrong impression. Once an overheating component is located, it is good practice to turn the board around and ensure that the heat source is not located on the reverse of the board.
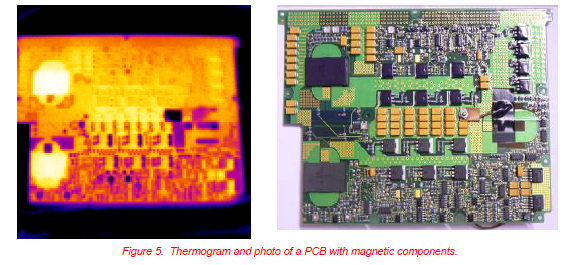
- Be aware of normally warm components such as transformers. Once the operator is aware of such components on the board, hot spots must be ignored with caution. Figure 5 shows a thermogram and a photo of a PCB with transformer cores that appear to be very hot. This board was soaked at 60ºC (140ºF) for more than 6 hours before the image was taken.
SUMMARY
During fault-finding procedures, measuring the temperatures of components on a populated PCB can be a very helpful and cost-effective technique, but is difficult due to the different e-values of the different components. When the board gets treated with a known, tested and characterized coating, it normally simplifies the problem. After coating, the component surfaces have the same e-values and the relative temperatures can be determined by taking a thermogram. This is not a fool proof method and has a number of pitfalls, but provides reasonably good and much more efficient results than some of the other methods.
ACKNOWLEDGEMENTS
The author wish to thank Saab Avitronics for providing the resources to make this work possible and specifically his co-workers who helped with all the measurements during the development and testing.
ABOUT THE AUTHOR
Rudie is an Electrical Engineer and a Level II thermographer and is working in the power supply department as a design engineer.