The Magic of the Invisible: Using IR Imaging in Physics Education
InfraMation 2013 Application Paper Submission
Vollmer and K.-P. Möllmann
University of Applied Sciences, Brandenburg, Germany
ABSTRACT
Infrared thermal imaging is obviously an excellent tool to visualize static and dynamic thermal phenomena in physics education, but only recently has the falling price of microbolometer cameras really allowed for widespread use in schools and universities. As a consequence, the teaching of physics in nearly all fields from mechanics, thermodynamics, electromagnetism, and optics can benefit. If properly used, the advantages of visualizing thermal processes associated with physics phenomena can lead to a much better qualitative as well as quantitative understanding. It may even change the perception of physics in as boring to the role it deserves in our technology oriented society–the most interesting and stimulating fundamental natural science at school and university.
INTRODUCTION
Unfortunately, physics at the high school and university level is quite often remembered as boring, difficult to understand, and much too complicated mathematically. Reasons for this perception of physics, and sometimes even sciences in general, are sadly, many. Fortunately, nowadays we have techniques and instruments available that can demonstrate the true fascination of physics. Changing the general perception of physics by providing understandable concepts that can reveal the magic secrets of nature can help make students aware it is the basis for modern everyday technologies.
An old Chinese proverb describes the process of learning in a nice way: ―Hear and forget, see and remember, do and understand.‖ When they think back to their school days, often people remember vaguely ―hearing‖ about physics—and unfortunately what they heard was often an impediment to learning rather than an incentive. Infrared imaging, on the other hand, as a visualization technique in teaching, parallels the ―see‖ in the second part of that proverb, helping students remember and understand concepts better and thus be more motivated to continue onward. Of course, the best learning technique is to actually ―do‖ things. Once introduced to IR imaging in physics classes, people may actually then use thermal technology to understand and solve problems later in life.
But enough of speculation, let’s focus on the potential IR has for visualization of phenomena that invisible to our eyes. As we initially proposed in 2001 [1] and expanded upon the following years, IR can be used effectively as a teaching tool in various topics at school and university level, both qualitatively as well as quantitatively [2-9]. Today, IR cameras are a standard piece of equipment in our physics lectures and we have developed an advanced infrared technologies course combining theory, experiments, and practical studies for bachelor students in microsystem and optical technologies at our university [10]). During this time, beginning at the InfraMation conference in 2004 in Las Vegas, we have also presented many diverse examples of IR applications [11].
Although the use of thermography for physics instruction was already proposed in 2001, most school teachers had to wait another decade before affordable cameras became available [12]. Today, the opportunity exists for thousands of physics and science teachers all over the world to enter the fascinating infrared world and discover the ―magic‖ behind physics phenomena. Infrared images and videos have enormous potential in physics and science education to overcome old prejudices and reveal the beauty of the many secrets of nature. Of course, teachers must also understand how cameras work and how to correctly interpret images [13]. In other words, physics instruction using IR should not just show colorful images, but increase knowledge—one should never forget the physics behind the picture [14]. Quite obviously, there is a lot of work ahead for training physics teachers and advising them of how to best use IR cameras in teaching.
The paper will present a small selection of fascinating applications of thermography in a large number of fields in physics from mechanics, thermal physics and electromagnetism to optics (see Chap. 5 in IR imaging textbook [13]). These uses of IR were successfully tested in many physics lectures and illustrate the magic of the invisible in physics education in one way or another.
SELECTED EXAMPLES OF IR IMAGING IN PHYSICS EDUCATION
All of the following examples have been discussed in detail in the literature, most of them were treated in [13].
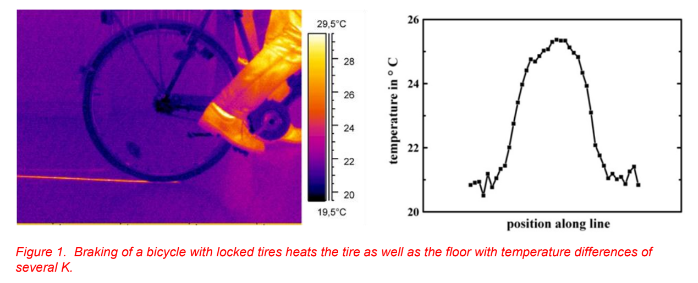
a) Energy transfer due to frictional forces
Visualization of thermal effects due to sliding friction of bicycles or motorcycles is an easy eye opener for children and students. Figure1 depicts a braking bicycle with locked tires. This leads to heating of the tire as well as the surface of the floor. The latter can easily amount to a few K.
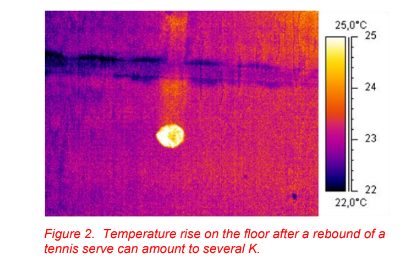
b) Energy transfer due to inelastic collisions
Similarly, any sports activity which includes inelastic collisions, e.g. the collision of a tennis ball with the floor, leads to a thermal energy transfer and therefore to a heating of both objects of the collision, the ball as well as the floor. Figure 2 shows an example of a floor just after it was hit with a tennis ball at high speed (about 100 km/h). Both the ball (here no longer visible in the image) and the floor had elevated temperatures after the collision. Temperature differences of well above 5 K may be reached for at least half a minute. This technique was also successfully tested in tennis tournaments to detect whether a serve is in the field or outside.
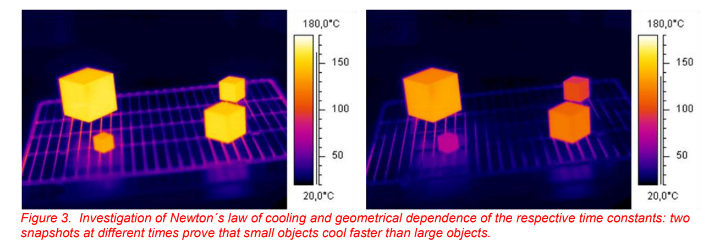
c) Transient heating and cooling
Dynamic thermal processes are usually governed by time constants which relate to the geometry and material properties of the objects. Cooling, for example, is often thought to follow a simple exponential law, denoted as Newton´s law of cooling. Figure 3 visualizes geometry dependencies of the cooling constants for four differently- sized metal cubes covered with black paint. Cooling is most efficient for small objects with a large surface to volume ratio. This explains why the smallest cubes cool very fast while the largest cubes are still very warm.
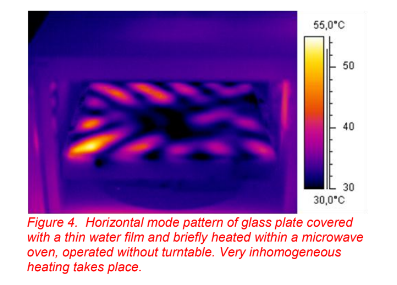
d) Visualization of electromagnetic fields
Thermal imaging is also useful for a variety of electromagnetic phenomena in physics. Figure 4 depicts an example recorded after a glass plate, covered with a thin film of water, was briefly heated in a microwave oven without using the rotating turntable. Microwave ovens resemble three-dimensional resonators for the electromagnetic waves (micro waves) giving rise to so-called standing waves. Like all standing waves in physics, e.g. vibrations of a guitar string, the wave has positions with maximum and with zero field amplitude. For microwaves, this means that at locations with large field amplitude, a lot of energy is available, which may be used to heat food. However, at locations with zero fields, there will be no energy transfer from the oven to the food. This means, that without turntable, such an oven would lead to very inhomogeneous heating as can be seen in Figure 4.
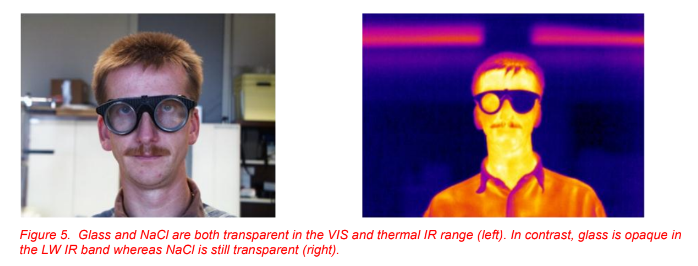
e) Illustration of different optical properties in VIS and IR range
Figure 5 shows an example of optical material properties in the IR range. Ordinary glass is opaque in the thermal IR range of LW cameras (λ=8-14 µm). Therefore a camera will only detect the surface temperature of the glass which more or less resembles ambient temperature. In contrast, a plate made of NaCl is also transparent in the IR range; thus an IR camera may look through the NaCl windows and detect the warmer background of the eye of the person wearing the glasses. This and similar experiments with optically transparent or opaque objects in various wavelength ranges are often surprising to students and are very motivating.
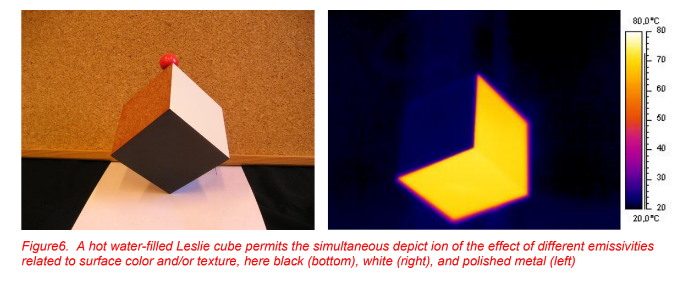
f) Comparison of different emissivities
The emission of infrared radiation from objects is one of the three basic heat transfer modes. It is not only governed by the temperature, but also by the emissivity of objects. It is very helpful to have an object such as a so-called Leslie cube which consists of a thin hollow copper cube whose surfaces are treated differently. Shortly after being filled with hot water, all surfaces will have the same temperatures. However, those painted with white or black color emit more thermal radiation than the rough or even polished metal surfaces, since their emissivities are very different. This is easily visualized in an IR image, computed from the object signal for a constant high emissivity (the one of the black color). In this case, the polished metal surface with a very small emissivity appears much colder since it emits much less thermal radiation (Figure 6).
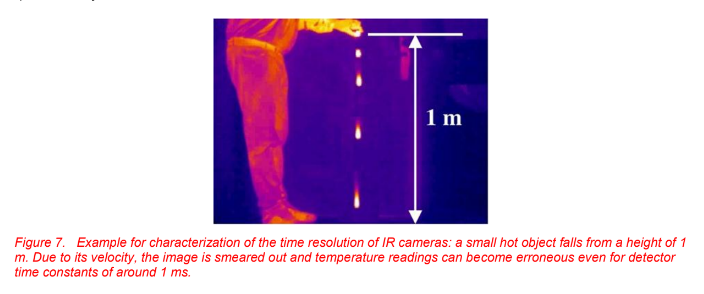
g) Understanding camera parameters: time resolution example
Infrared cameras are characterized by a set of parameters governing their spatial, time and temperature resolution and accuracies. Everyone applying thermography for quantitative measurements must know these parameters. One easy example for students to determine the time resolution of an IR imaging system consists in observing a hot ball, falling in the gravity field of Earth (Figure 7). Due to its motion, the image will be smeared out, if the detector time constants are of the order of ms, which is usually the case for LW bolometer cameras. This may lead to measurement errors and incorrect interpretations. This experiment helps students to know if or under what circumstances, thermal cameras can measure quantitatively.
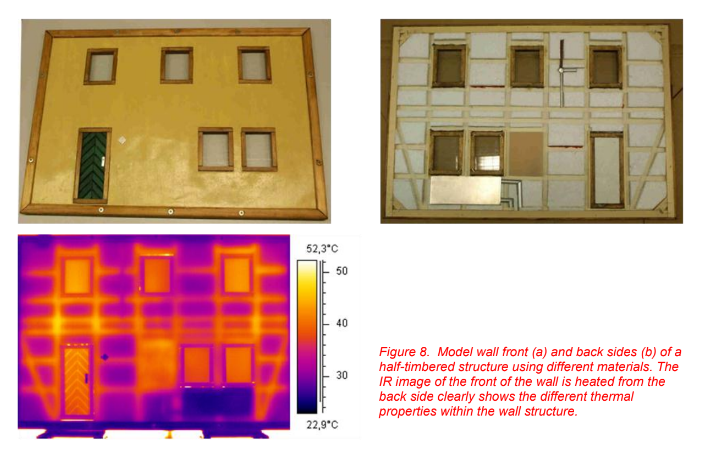
h) Application: models for building thermography
One of the most important applications of thermography is analysis of building envelopes. Therefore, student projects can be set up with sample building walls, made of typical materials with different thermal conductivities and thermal insulation properties. Figure 8 depicts an example, prepared by students, of a model building that represents a wall of a half-timbered structure behind plaster. Wood, Styrofoam, glass, and metals were used as well as a thin layer of plaster on top of the wall. When placed in front of a heating plate and observed with an IR camera, one can simulate the conditions of a similarly constructed house in wintertime. Figure 8c nicely demonstrates that regions with different thermal properties within the wall show up easily.
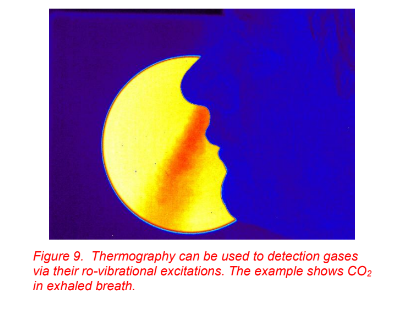
i) Application: visualization and detection of gases
Finally, a modern application of IR cameras is gas detection. This can be demonstrated in teaching in the context of vibrational spectroscopy of gases. One may either use LW cameras for SF6 or MW cameras for CO2. Figure 9 depicts the exhaled CO2 in breath detected with a MW camera equipped with a band pass filter in front of the detector. Clearly, even the small concentration of several volume percent of CO2 is easily visible in front of a warmer background due to absorption of the gas. This technique is nowadays regularly used in the petrochemical industry to detect hydrocarbons.
REFERENCES
- Karstädt, D.; Möllmann, K.-P.; Pinno, F.; Vollmer, M.; ―There is more to see than eyes can detect: visualization of energy transfer processes and the laws of radiation for physics education‖; Phys. Teach. 39, 371-376 (September 2001)
- Möllmann, K.-P.; Vollmer, M.; ―Infrared thermal imaging as a tool in university physics education‖; Eur. J. Phys. 28, S37-S50 (2007)
- Vollmer, M.; ―Physics of the microwave oven‖; Phys. Ed. 39/1, 74-81 (2004)
- Vollmer, M.; Möllmann, K.-P.; Karstädt, D.; ―More experiments with microwave ovens‖; Phys. Ed. 39/4, 346 – 351 (2004)
- Vollmer, M.; Möllmann, K.-P.; Karstädt, D.; ―Microwave oven experiments with metals and light sources‖; Phys. Ed. 39 500-508 (2004)
- Planinsic, G.; Vollmer, M.; ―The surface to volume ratio in thermal physics: from cheese cube physics to animal metabolism‖; Eur. J. Phys. 29, 369-384 (2008)
- Vollmer, M.; ―Newton´s law of cooling revisited‖; Eur. J. Phys. 30, 1063-1084 (2009)
- Vollmer, M.; Möllmann, K.-P.; ―Caustic effects due to sun light reflections from skyscrapers: simulations and experiments‖; Eur. J. Phys. 33, 1429–1455 (2012)
- Vollmer, M.; Möllmann, K.-P.; ―Surface temperatures of the Moon: measurements with commercial infrared cameras‖; Eur. J. Phys. 33, 1703-1719 (2012)
- Special issue on infrared, Eur. J. Phys. 34, November 2013
- See more than 30 contributions by M. Vollmer and K.-P. Möllmann in the Proceedings of Inframation conferences from 2004 to 2012.
- C. Xie, C.; Hazzard, E.; ―Infrared Imaging for Inquiry-Based Learning”; Phys. Teach. 49, 368-372 (2011)
- Vollmer, M.; Möllmann, K.-P.; „Infrared Thermal Imaging: Fundamentals, Research and Applications‖; Wiley (2010)
- Möllmann, K.-P.; Vollmer, M.; ―The Allure of Multicolored Images – Building Thermography Examined Closely‖ ‖; Inframation 2013, Proc. Vol 14
ACKNOWLEDGEMENTS
We would like to thank D. Karstädt and F. Pinno for help with some of the experiments.
ABOUT THE AUTHORS
Michael Vollmer studied physics in Heidelberg, Germany, receiving a PhD (1986) and Habilitation (1991) in optical spectroscopy of metal clusters. Since 1994, he has been a professor of physics at the University of Applied Sciences in Brandenburg, Germany, working in the fields of infrared thermal imaging, spectroscopy, atmospheric optics, and didactics of physics. He is a Level II Thermographer and co-author of the textbook Infrared Thermal Imaging – Fundamentals, Research and Applications, published in 2010 by Wiley.
K.-P. Möllmann studied physics in Halle and Berlin, receiving his PhD in 1983 and Habilitation (1989) in solid state physics, in particular in the development of HgCdTe infrared detectors. Since 1994, he has been a professor of physics at the University of Applied Sciences, in Brandenburg, Germany. He has worked in infrared thermal imaging, pyrometry, thin film and MEMS technology, and is a Level II Thermographer. He is co-author of the textbook Infrared Thermal Imaging – Fundamentals, Research and Applications, published in 2010 by Wiley.