The Value of Thermal Trends in Predictive Maintenance Processes
How do manufacturing and production processes protect their equipment from faults and failure, especially when equipment begins to age? Everything that ages experiences friction, wear, oxidation, heat and other stresses will eventually reach a point where performance deteriorates or failure occurs, but identifying when that will happen is key to managing any production process in an efficient and commercially responsible manner.
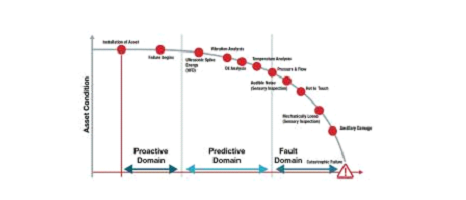
Condition Monitoring professionals will be familiar with the P-F curve which highlights which predictive maintenance process will provide insights onto the condition of equipment during the proactive, predictive and fault stages of a component’s lifecycle. Thermography is a key condition monitoring technique that can be used as an early indication to predict when an asset or machine may require attention, before a fault has developed.
Thermography is a technique where the temperature readings are recorded from an asset, and while a single temperature reading may provide a level of insight and information, typically that value is of limited use on its own. Lets look at this in more detail using an example of an electrical motor:-
If, an electrical motor in a factory was running at 73°C (163°F) would this be a concern? The answer is ‘nobody knows’ without more information. The Facilities Manager or Technician responsible for the motor could identify the make and model of the electric motor, review the motors specification sheet and try to find the standard operating temperature range; then evaluate if the current temperature is within the operational norms. Would that provide a good indication of the condition of the motor? Unfortunately, not.
In this example, we could find that the current temperature of an electrical motor is 73°C (163°F) however the ‘standard operating range’ is 50°C (122°C) to 80°C (176°F), so currently the motor is operating at the higher-end of ‘normal’, so when should this be re-inspected? What is the current condition? When is maintenance required? Will it fail? We still don’t know, or have any ability to predict the future condition of this motor.
What is missing is a trend, base-line or pattern of the normal operating conditions of this motor. With such a broad range of standard operating temperatures it is difficult / impossible to know the condition of the motor with a single measurement. The load applied to the motor will change its operating temperature, as will cooling airflow, climatic conditions, and other internal and external factors too. Building a trend of operating temperatures will allow a Condition Monitoring specialist to accurately assess the condition of the motor.
If an electric motor was installed in January 2019, and monthly temperature readings were taken, then these temperatures could be plotted to identify what the ‘operational norms’ are for this specific motor, in this location, powering this specific process, etc… a well functioning motor with no issues may record temperatures similar to the graph shown below:-
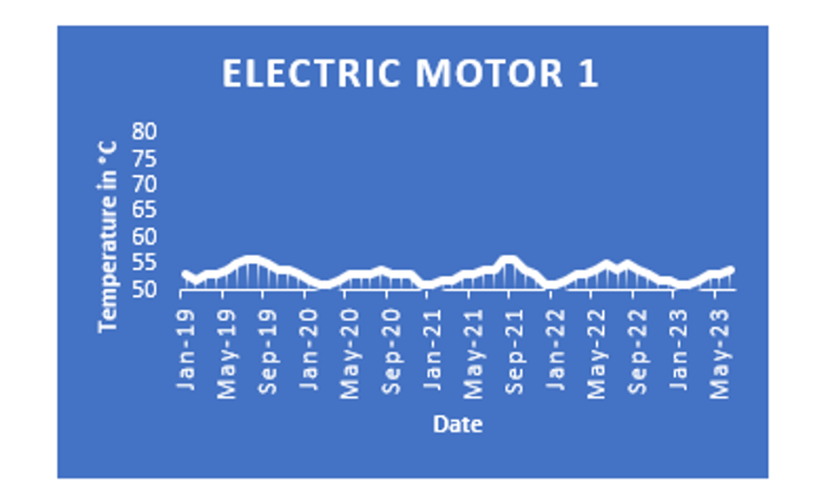
This graph shows an electric motor that has a degree of temperature fluctuations between 50°C and 55°C which track reasonably well with the seasons of the year, getting warmer in the summer and cooler in the winter. So what do we learn from this, what can we infer? Well, the motor is operating at the lower end of the standard operating temperature range and does not appear to be mechanically overloaded or under an especially high load. A Condition Monitoring professional may even decide to inspect this motor every 2 or 3 months, unless temperatures change significantly. This motor shows no obvious signs of concern and we would expect it to continue working reliably for the foreseeable future.
Another motor was also installed next to this one in 2019, and its temperature readings have also been captured on a monthly basis, below you can see how that motors temperature compares:-
What can we deduce from this trend? Well, the temperatures started off fairly similar to ‘Motor 1’ exhibiting the seasonal changes in temperature, however by 2021 temperatures were creeping up regularly compared to prior years, and compared to motor 1 too, so this is indicative of an issue developing. Something happened in Aug/Sep 2022 to bring the temperatures back down, and now the operating temperatures appear to be ok.
All of this has happened at the lower end of the motors ‘operational norms’ so may be no cause for concern, however we know ‘the story’ of this motor and we can predict with a degree of certainty how reliable we can expect this motor to behave.
This type of trend is normal in dusty or dirty environments where the cooling fins and air flow holes slowly become blocked, causing a slow and steady rise in temperature, then if the motor is cleaned, cooling efficiency is returned. However, this trend could easily have been caused by another issue such as motor loading, larger debris, replaced drive chains or belts, the placement of a cooling fan or hot air extraction, etc… Thermal graphs identify an anomaly but cannot be used to predict the cause.
A graph like this will serve as a timely reminder to perform basic cleaning and maintenance periodically, to be conscious of how other influencing factors can affect motor temperature, and to ensure that basic things like motor cooling do not develop into more serious issues over longer time periods.
Finally lets look into a third electric motor that was also installed in 2019 and see how that compares:-
This motor could be the first motor discussed at the beginning of this article, with a temperature reading of 73°C, which is within the operating norms for this motor according to the manufacturers specification.
Taking a single temperature reading of 73°C was potentially no cause for concern as a one-off data-point with no additional information, in fact such a temperature reading could be interpreted as reassuring, however the thermal trend tells us another story.
So what does this graph tell us? That the motor was operating in-line with the seasonal variations experienced every year by ‘Motor 1’ and ‘Motor 2’, also operating at the lower-end of the standard operating temperature range set by the motor manufacturer. However something has happened since January 2023 that has caused the motors temperature to increase, which may be a cause for concern and require further investigation.
What could the future look like for this electric motor? Well, there are several potential scenarios shown by the two graphs below. If this motor was left in use with no investigation, maintenance or further action then the temperature could continue to rise until the point of failure. This is shown by the graph on the left and provides an insight that temperatures exceeding 105°C cause immediate failure.
The graph on the right tells a different story, perhaps the demand placed on the motor was purposely increased by the production process that the motor operates being sped-up to meet a new output requirement? The temperatures are still within the motors acceptable operational range and there is a clear explanation as to the root cause of this thermal anomaly.
What can we conclude from this article?
Individual temperature readings provide an insight into the condition of equipment which can only be compared to the manufacturers recommended operational range for a motor, or other asset in a manufacturing or production process. This can be misleading and will fail to provide real insights into the condition of assets and equipment which may be vital to the reliable operation of a business.
Taking regular temperature readings builds a picture of the condition of every asset inspected. This does not mean that temperatures will never change, but there will often be reasons for thermal anomalies. If there is an unexplained temperature change then it may be possible to inspect, clean, maintain or take other action to restore the equipment to its normal operating temperature – or it may simply now run hotter and require further monitoring to predict the point of failure more accurately.
Thermal cameras such as the FLIR E8 Pro or the FLIR E96 are commonly used in manufacturing or production environments to take temperature readings accurately however, those one-off temperature readings have a very limited value without the thermal trending and analysis that can be undertaken using software such as FLIR Thermal Studio. Thermal trending and analysis over time is the vital element which is so often overlooked when learning more about thermal cameras and thermography in general, however this is where insights and value is generated.
If your business relies on manufacturing or production equipment, electrical panes, motors, pumps, machinery or other mechanical or electrical equipment to survive then it is probably important to you that this equipment doesn’t fail unexpectedly.