Effect of Solar Load on Equipment Condition Inspection and Assessment using Thermography
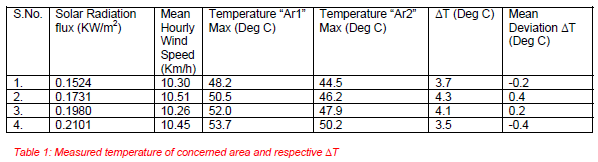
InfraMation 2009 Application Paper Submission
Pawan and Nitesh Kumar Singh
Cholamandalam MS Risk Services Ltd., India
ABSTRACT
Weather affects all forms of thermography. A major issue in thermography is the effect that different ambient conditions and solar loading has on the components. The annual average global solar radiation on horizontal surface, incident over India is about 5.5 kWh per square meter per day. There are about 300 clear sunny days in most parts of the country.
So the real time thermal imaging of connections and surface of switchyard equipments such as isolators, D.O fuses, bushing contacts ,Lightning Arrestors ,CB,CT and PT along with other objects which can be exposed to Solar Load becomes a real challenge for thermographers as they become misleading as we may miss the minor faults due to the effects of solar loading and requires detailed steps that can be taken to improve the infrared results to provide for greater confidence in the interpretation of the data collected. As even small temperature rise on the outside surfaces can be seen by the infrared camera which are affected by solar and wind loads, which can’t be neglected in typical Indian conditions.
Our study focuses on observing the variation in surface temperature of the target object using the profile functions of ThermaCAM® Reporter, proprietary software of FLIR, under different solar loading conditions. The various parameters considered for the study are solar azimuth angle relative to the target, relative wind velocity near the target surface, the cross-sectional area of the target facing the wind, solar radiation on the target, material of the target and emissivity of its surface.
The convection and radiation are the primary modes of heat transfer for attaining the thermal balance between external surface of the target and its surrounding. The rise in temperature affects the power loss depending on the rise in internal electrical resistance of the target assuming there is no variation in electrical load and thermal time constant of the target as small. This may further affect the thermogram pattern.
INTRODUCTION
Infrared surveys are carried out at different substations for predictive and preventive maintenances with mainly these parameters; emissivity, ambient temperature, humidity, distance and reflected temperature. As far as environmental factors are concerned, there are two other parameters which play a major role in analyzing the IR images, especially when minor faults have to be identified. These two factors are solar and wind load.
In this paper we have considered the effect of solar radiation and the cumulative effect of solar radiation and wind load. In practical scenarios, both of these parameters (for outdoor equipments) play a vital role depending upon the size, area, cooling system design etc of equipment along with solar radiation and wind velocity.
Thermographers in the field rarely take these parameters into account, but in real scenarios it can lead to the misinterpretation of IR images. Solar load individually adds packets of energy which effectively increases the temperature of the object (under solar radiation), whereas wind load, due to convective heat transfer cools the object, which may lead to good results. However, if interpretation is made quantitatively, one may wrongly calculate temperature as they have not compensated for temperature with regard to solar radiation because the temperature shown will be T Object + ∆T Solar Load. For a more precise value of the temperature of the object being examined, we have to consider the angle of incidence for the solar radiation.
Also to be noted is the shape and design of the object for natural cooling, which can affect and nullify solar loading. In this regard, transformer fins are the best example. To visualize the above described phenomena we have taken three cases to validate them within a real scenario.
CASE 1: MINOR FAULT (WHEN ∆T IS SMALL)
Figure 1a & 1b is the IR image of the B-phase and Y-phase of a 33 KV line isolator. This isolator is used to isolate the 1400 Ampere (rated) load and then the loading was 900 Amperes. In this case we have taken minor fault studying consideration and its ∆T and temperature variation profile using ThermaCAM, under solar & wind load.
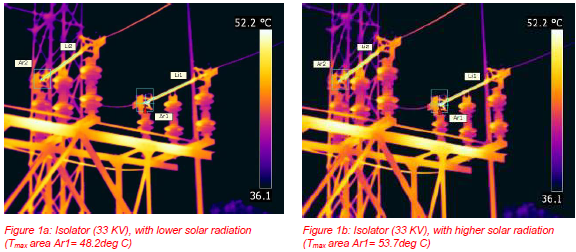
In the above image, the difference in temperature between area Ar1 and area Ar2 shows a minor fault, at a certain solar load (detailed chart is given below) & wind load. The readings taken at certain intervals of time (1 hour) are shown below:
It is interesting to see that with increase in solar load, the temperature of both the points under observation increases, but the ∆T doesn’t vary comparatively, which shows that under solar load, qualitative analysis can be done without losing the real pattern of minor faults which can’t be seen if only wind load is taken into account. This validates that if solar load is present (along with wind load) it can provide more realistic results, as it compensates the effect of wind. To analyze more precisely we took profile function in ThermaCAM to see the temperature variation in both the cases, which were also found to be supportive to the above shown table. (Figure 2a & 2b, corresponding to Figure 1a & 1b respectively).
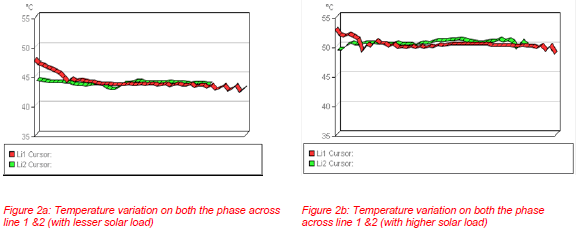
In the above figures (2a & 2b) it can be seen that the net effect of solar load has increased the overall temperature profile of the isolator along the length, rather than any other adverse effect in thermal pattern. Effectively the Y-axis values have shifted on higher side due to addition of energy packets to the isolator.
CASE 2: MAJOR FAULT (WHEN ∆T IS LARGE)
In this case the electrical parameters (loading & ratings) remains same as in case 1, but the object monitored is having a major fault (CT termination, 33KV) and the variation in temperature is noted with the same level of solar radiation, but the change in temperature was noticeable.
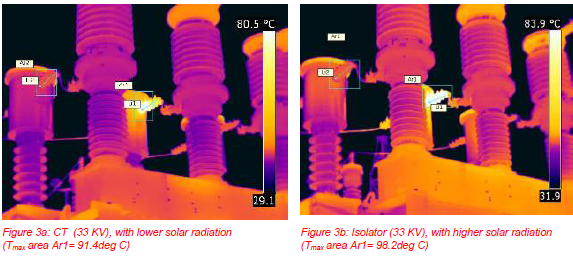
In the above images the CT termination has been seen, the ∆T in this case is >45 deg C. (detailed table in next page)
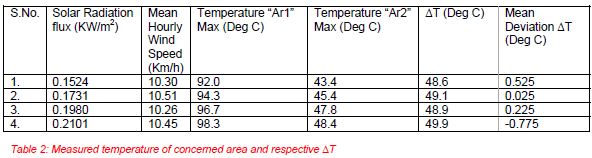
In this case, it can also be seen that ∆T (deviation) is very less and thus, under solar load qualitative study, can be done without any major changes in ∆T. To analyze more precisely we took profile function in ThermaCAM to see the temperature variation in both the cases, which were also found to be supportive to the above shown table. (Figure 4a & 4b, corresponding to Figure 3a & 3b respectively).
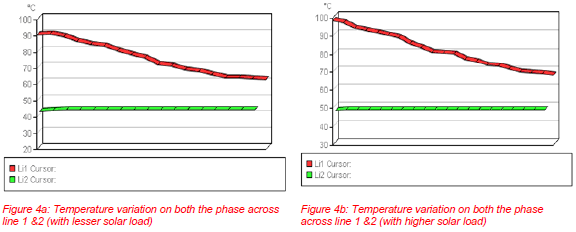
In this case too, it can be seen that solar load is much greater in the second case (Figure 4b), but the pattern of line function remains same and temperature gradient is similar with Y-axis values shifting up.
When the Case 1 and Case 2 were compared, they were quite similar in terms of IR patterns and thermal gradient variation. Even the heat balance equation justifies, a slight variation in gain of temperature of the object under same solar load:
In steady state the heat conducted along the length of cylindrical conductor is given by:
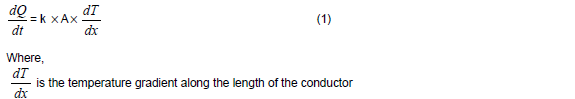
A is the cross sectional area
k is the coefficient of thermal conductivity
The heat loss from the curved surface of the conductor due to convective effect of wind blowing over its surface is given by:
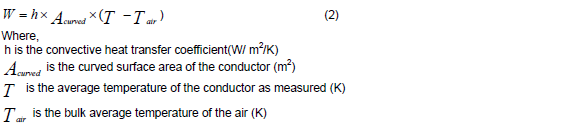
The heat balance equation gives:
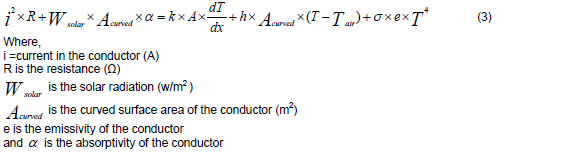
In Case 1 the rise in temperature is around 5.5 deg C, whereas the rise in Case 2 is around 6.3 deg C (under same solar & wind load). This difference can be justified from equation (3), which includes α as a parameter which is higher for case 2 (object under consideration is copper).
CASE 3: EQUIPMENTS WITH COOLING COMPONENT (TRANSFORMER FINS)
In this particular case, we have considered transformer fins and analyzed the effect of solar load on them. The results were a bit strange but later it matched with the mathematical model. The cooling arrangement in equipment behaves quite well in handling solar load effect.
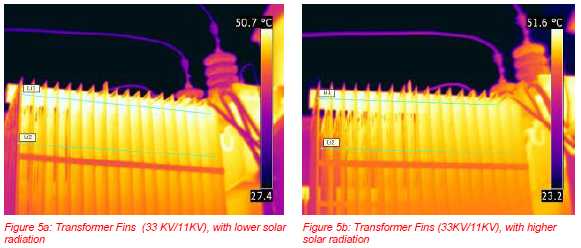
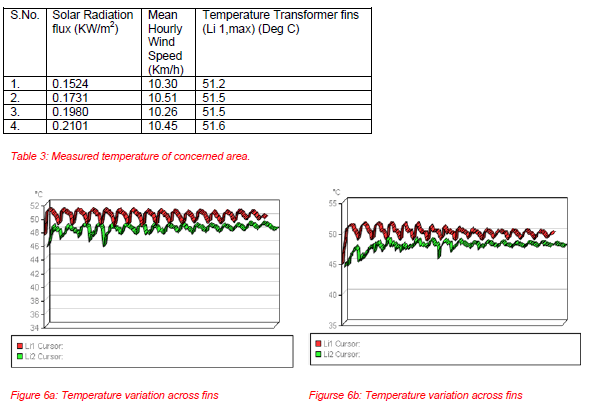
In this particular case we can see interesting results when compared to case 1 & case 2. If we compare figure 6a & 6b, it can be seen that there is no significant change in fins temperature with increasing solar radiation. The above shown curves hold true and can be justified with the following heat balance equation:
The heat balance equation for transformer is given by:
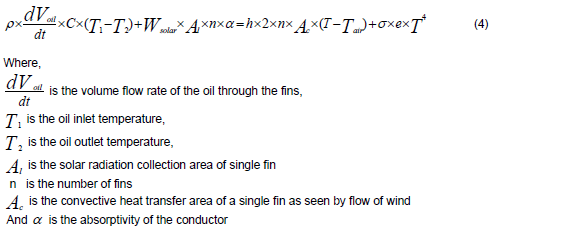
In the above equation if we analyze each term we can find out with increasing solar load the effective heat transfer increases, which results in a higher rate of convection waves (oil), that is the rate of oil flow inside fins and air displacement rate along fins increases. This in turn effectively nullifies the effect of solar load.
SUMMARY
Solar load and wind load collectively plays an important role in switchyard thermography; however studies done under solar load in this paper show that the over all rise in temperature (with wind load) will not change the IR pattern and the qualitative values will remain same, however the material property has to be taken care of. As far as minor faults are concerned the probability of missing the same is more under wind load and lesser under presence of solar load because the net thermal gradient (pattern) remains similar. The cooling equipment when studied under solar load the net gain in temperature was found to be negligible, hence both the qualitative and quantitative studies can be done effectively.
ACKNOWLEDGEMENTS
The authors wish to thank Mr. Subba Rao NV, Head & VP, Cholamandalam MS Risk Services Ltd. and Mr. Anandan E, Manager, Cholamandalam MS Risk Services Ltd. and Ms. Maud Hovens, Iris Thermo vision for their full support in arranging the studies and providing technical details. Also we would like to thank Mr. Jothibasu M for providing his insight on basics of thermography.
REFERENCES
“The secrets of transformer cooling”, InfraMation, John L. Giesecke
“Hazard rate estimation for high-voltage contacts using infrared thermography”, Tommie M. Lindquist, Lina Bertling
“Power plant thermography –Wide range of applications”, InfraMation, Michael J Ralph
“Maintenance approaches of power electrical equipments focused on condition monitoring of power transformers”, Jaroslav Špaček
“Prediction of Hottest Spot Temperature (HST) in Power and Station Transformers”, M. K. Pradhan and T. S. Ramu
“The Infrared Thermography Diagnostic Technique of High-Voltage Electrical Equipments with Internal Faults”, Niancang, Hou
“Review of condition assessment of power transformers in service”,
- Wang and A.J. Vandermaar, K.D. Srivastava
ABOUT THE AUTHOR(S)
Pawan and Nitesh Kumar Singh is level I thermographer and working with India’s esteemed Risk management company, Cholamandalam MS Risk Services Ltd and have carried out thermography studies in wide range of industries. They have done projects related to IR in their colleges too for IIPC-08 and later worked with CEERI, PIlani, India on the same. And they have carried out more than 70 thermography studies through out India.