Thermography of Microsystems
InfraMation 2004 Application Paper Submission
K.-P. Möllmann, N. Lutz, and M. Vollmer, University of Applied Sciences, Brandenburg
Ch. Wille, Clariant GmbH
ABSTRACT
The development and optimization of microsystems, such as microreactors, micro heat exchange systems, microactuators, microsensors, and others, often require the knowledge of the temperature distribution within the microsystem. This paper deals with the application of thermography in the 3.5 - 5.5 µm and the 8 -14 µm spectral bands to such microsystems. The spatial resolution of the temperature measurement was as low as 60 µm, and the time resolution was 20 ms. The results show that this microthermography method is a powerful tool for the characterization of such microsystems with respect to:
- precise characterization of time-dependent chemical reactions and spatial distribution of the reaction zone in falling film, glass, and silicon microreactors.
- determination of heat transfer efficiency in micro heat exchange systems.
- characterization of micro Peltier coolers and micro cryogenic actuators.
- characterization of temperature distribution on semiconductor gas sensors.
MOTIVATION
Microsystems engineering is likely to be a key technology in the twenty-first century. Microsystems promise to revolutionize nearly every product category. Light-weight and compact microreactors with increased heat and mass transfer rates become possible. This results in highly efficient devices for chemical reactions with extremely precise control of process conditions.
MEMS (micro-electro-mechanical systems) is an enabling technology that allows the development of smart products, augmenting the computational ability of microelectronics with the perception and control capabilities of microsensors and microactuators, and expanding the range of possible applications. For a lot of microsystems, the temperature, the spatial temperature distribution, and thermal response time are among the most important parameters. Obviously, a contactless measurement is needed to analyze these parameters for microsystem components (reactors, sensors, actuators). Hence, thermography can play an important role for the thermal characterization of different microsystems to support research and development work and to control system operation without modifying system performance.
MICROREACTORS
Falling Film Reactor
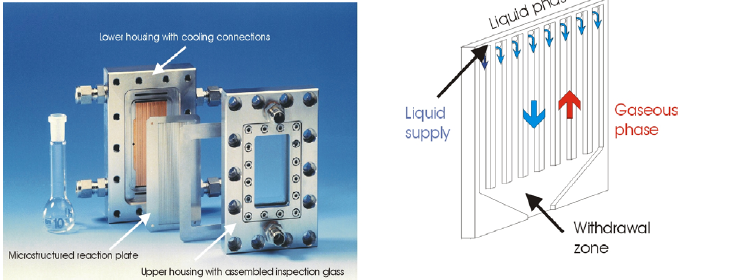
DESIGN AND OPERATIONAL PRINCIPLE OF THE FALLING FILM MICROREACTOR In Figure 1 the components of the falling film microreactor are shown. It can be used, e.g., for gas-liquid reactions. Figure 1 (right) illustrates the principle to generate thin films in the µm range on a reaction plate with microchannels. The fluid is distributed on the reaction plate and flows downwards to the withdrawal zone at the bottom as a fluid film. While the flow direction of the liquid reactant corresponds to the direction of gravity, the gaseous phase can be guided co- or counter-currently relative to the liquid phase.
In order to detect the zone of chemical reaction, to measure fluid equipartition and temperature profiles at the fluid film on the reaction plate, a FLIR→ ThermaCam SC 2000 IR camera with a 24° lens was used. To enable thermal process control, the microreactor was equipped with an IR transparent inspection glass (626 µm thick Si wafer). In addition, the use of a close-up lens allowed measurements at high spatial resolution (about 200 µm) sufficient to reveal details smaller than the characteristic dimensions of the microreactor.
MONITORING FLUID EQUIPARTITION
In the first experiment on the falling film microreactor, the homogeneity of the microchannels was tested by studying the wetting behavior of the reaction plate using isopropanol under non-reacting conditions. The isopropanol film was heated above room temperature to 30°C by an integrated micro heat exchanger. As the emissivity of the microstructured reaction plate, manufactured in high-alloy stainless steel (ε ≈ 0.5), differs strongly from that of liquids (ε ≈ 0.9), areas wetted with isopropanol show a bright white color, whereas the dry areas emit less radiation and show black. This effect was used for easily imaging the fluid equipartition in parallel channels. In Figure 2 a sequence of the starting wetting behavior at a volume flow of 250 ml/h isopropanol is shown for a reaction plate with 15 channels at different times.
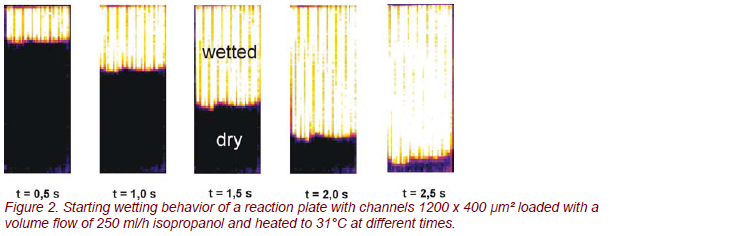
With respect to the fluid equipartition, the results are in excellent agreement with former investigations [1]. It is obvious that a very uniform residence time distribution was achieved, since the fluid front has moved the same distance in all microchannels.
THERMAL PROCESS CONTROL IN THE FALLING MICROREACTOR
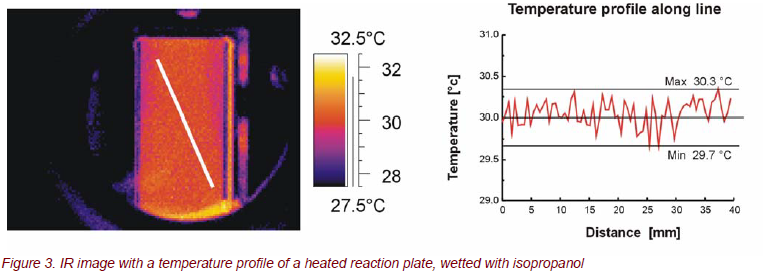
Heat management plays an important role for many reactions. Contactless temperature measurement using IR cameras enables the recording of a temperature profile of a complete reaction plate, with a single measurement at high spatial resolution sufficient to reveal details smaller than the characteristic dimensions. Figure 3 (left) shows an IR image of the temperature distribution of the reaction plate, wetted with isopropanol under non-reacting conditions while Figure 3 (right) reveals a temperature plot along a line depicted in IR image, extracted from the corresponding data of the IR image, crossing several microchannels. Apart from reflection of environmental radiation at the bottom of the reaction plate, the temperature profile is very homogeneous. The maximum deviation from the set value of 30°C amounts to ± 0.3°C along the line; for the whole reaction plate area of 27 mm x 65 mm, it amounts to about ± 0.5°C.
MONITORING CHEMICAL REACTION ZONE OF CO2 ABSORPTION IN NAOH(AQ)
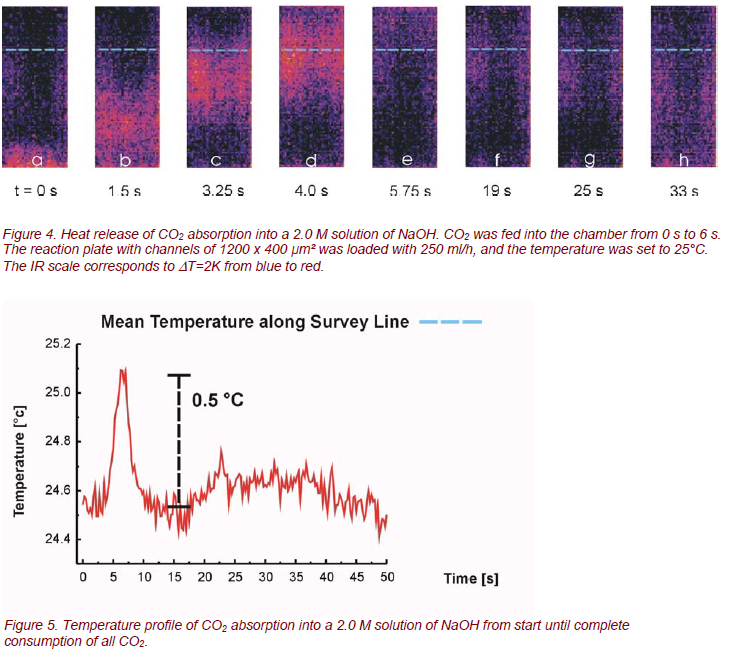
The aim of the investigation was to monitor the temperature increase of the liquid phase due to an exothermic reaction with a gaseous reactant [2, 3]. The investigations were performed in a batchwise manner: the reaction plate was loaded with a defined liquid flow of NaOH under stationary conditions and an over stoichiometric amount of pure CO2 was fed into the gas chamber in counter-flow to the falling film. The molar concentration of the NaOH solution was 2.0 M, the liquid load of NaOH was 250 ml/h, and the reaction plate was heated to 25°C by the integrated heat exchanger. In Figure 4 a sequence of IR photos is provided, illustrating the heat release of a 2.0 M NaOH solution after opening a valve for CO2 supply. The varying position of the reaction zone within the series of images can be explained as follows: As CO2, which is heavier than air, is fed in from the bottom into the gas chamber, the reaction front rises as the CO2 level increases in the gas chamber (Fig. 4a - 4d). Complete filling of the gas chamber with CO2 is identified when the reaction front is leaving the observable area of the reaction plate, and the reaction is quenched at the bottom (Fig. 4e). At t ≈ 6 s the gas chamber is filled with an excess of CO2. The reaction now only takes place at the entrance port of NaOH. Then the CO2 supply is stopped. As the CO2 level in the chamber decreases, the reaction front starts moving downwards again (Fig. 4f, 4g), thereby consuming the remaining CO2 in the chamber. Whereas the streaming in of the CO2 at the beginning of the experiment is a fast process, the consumption of it is a slow process of diffusion, showing a broad reaction zone with a small temperature peak. The CO2 absorption into a 2.0 M solution of NaOH results in a significant temperature increase of about 1.5°C, which is in the same order of magnitude as calculated data [4].
GLASS MICROREACTOR
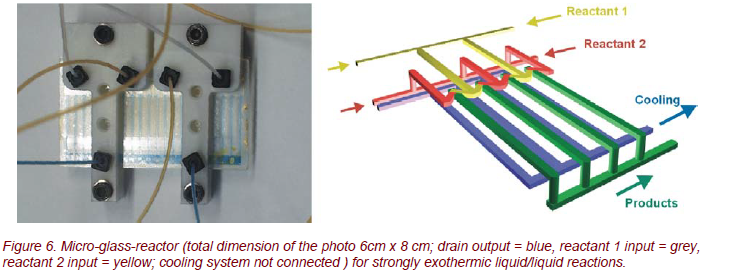
The Fraunhofer ICT developed a glass microreactor for controlled liquid/liquid chemical reactions with strongly exothermic behavior [5]. This reactor, shown in Figure 6, is made from photo-etchable, chemical resistant, and temperature-stable Foturan® glass.
The reactant liquids are injected through the inputs reactant 1 and 2 (Fig.6). The chemical reaction occurs within the mixing and the reaction channels (width approximately 120 µm). A separate cooling system is integrated in the microsystem behind the reaction channels.
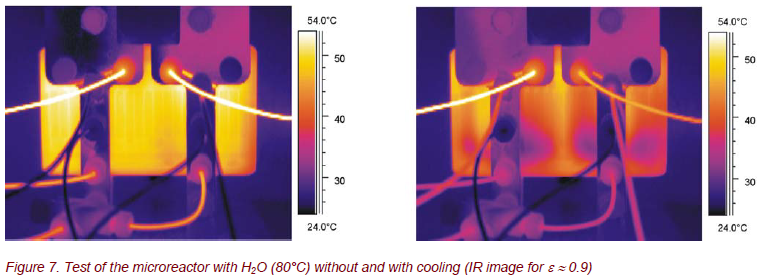
Within the wavelength region 3 to 5 µm, the Foturan glass with a thickness of 1 mm shows a transmission of 50%. Therefore, thermal processes inside the reactor can be observed using a short wave IR camera THV 550.
During the first tests with hot water (T ≈ 80°C), strong temperature inhomogeneities were found (Fig. 7). These inhomogeneities are amplified during additional cooling with room temperature water. These results can be used to optimize the assembly of the reacting and the cooling channels.
As a chemical test reaction, 96% sulfuric acid was diluted with water. Figure 8 demonstrates that time dependent, spatially resolved thermography is a powerful method for an adjustment and control of the process parameters.
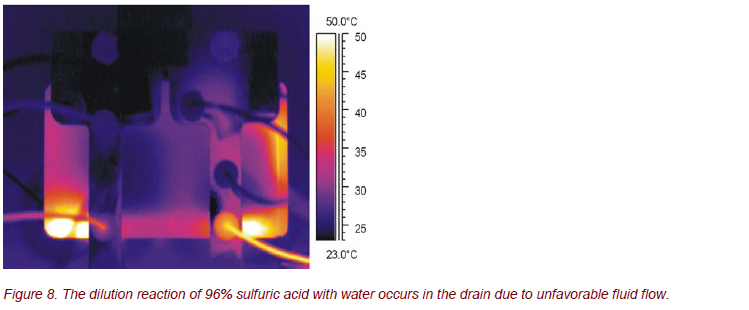
If the flow rates and/or the flow rate ratio of the reactants are unfavorably selected, the chemical reaction occurs not in the microchannels, as desired, but uncontrolled and without necessary cooling within the drain.
These results are used to improve the design of the microreactor to ensure a homogeneous and controlled chemical reaction inside the reaction channels.
SILICON MICROREACTOR
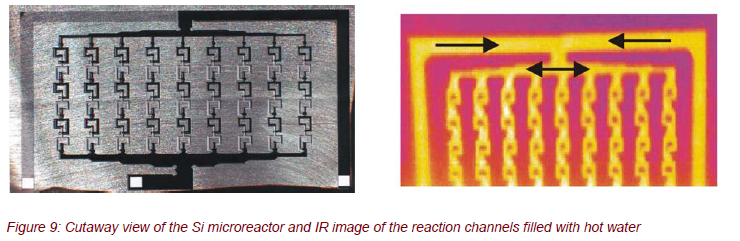
The silicon microreactor shown in Figure 9 was developed for process-controlled, strongly exothermic liquid/liquid chemical reactions within 9 parallel microchannels (channel width approximately 300 µm). The special geometry and the configuration were designed by computer simulations for an optimum mixing of the reactants. The silicon microreactor should be applied, e.g., for the nitration of diethyl urea with N2O5.
The thermography analysis of this nitration reaction of urea results in an unexpected surprise. In contrast to expectations, inhomogeneous reactions occurred with hot spots along the reaction channels (Fig. 10). Dependent on the pressure, the flow-rates, and the temperature of the reactants within the reaction zone, the IR images show time-dependent, localized hot spots like “thunderbolts” in different reaction channels.
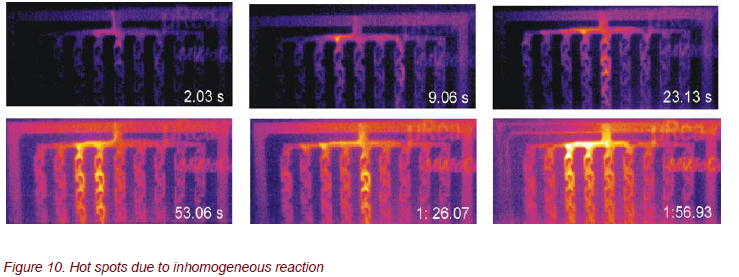
So far, the reasons for these unexpected results are unknown. The structures and the geometries of the reactor have to be improved in order to get a homogeneous and continuous distribution of the chemical reaction across the whole reactor.
MICRO HEAT EXCHANGE SYSTEM
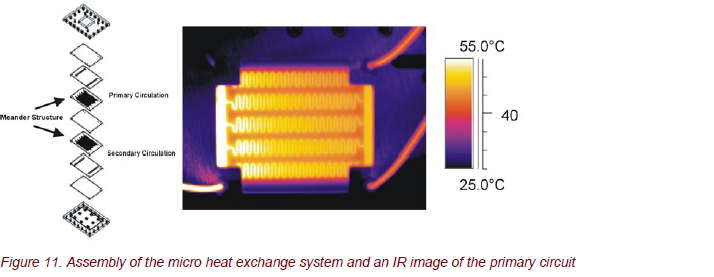
The mgt mikroglas technik AG, Germany, has special know-how in the development of microstructured glass components [6]. One of the latest developments of mikroglas is a micro heat exchanger made from photo etchable Foturan glass.
The assembly of the micro heat exchange system is shown in Figure 11. The primary and the secondary circuits are identical in meander construction. The channels of the primary and the secondary circuits are directly on top of each other, separated by a Foturan glass plate with a thickness of 200 µm. Both circuits branch out to 5 meanders with approximately 700 µm channel width.
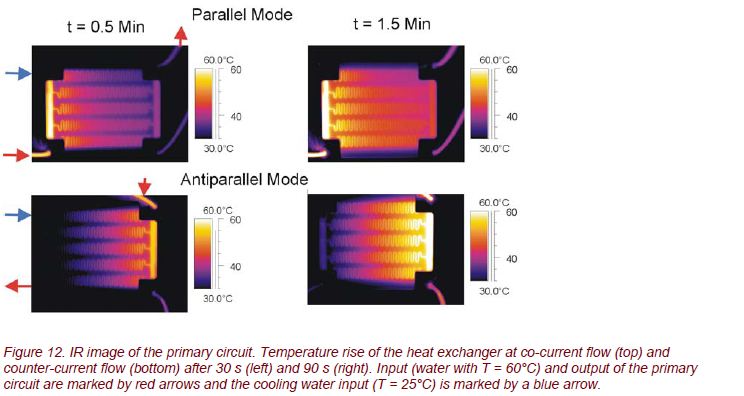
Applying time- and spatially resolved thermography, the thermal processes and the heat transfer in the micro heat exchanger can be studied precisely. The different operation methods (co-current and counter-current flow or parallel and antiparallel mode) can be characterized very accurately (Fig. 12).
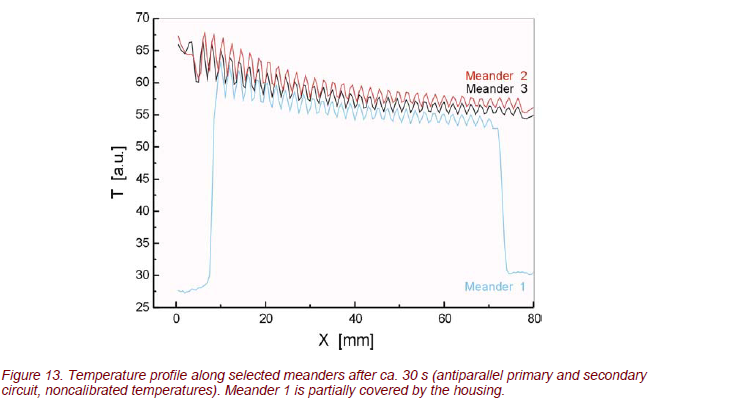
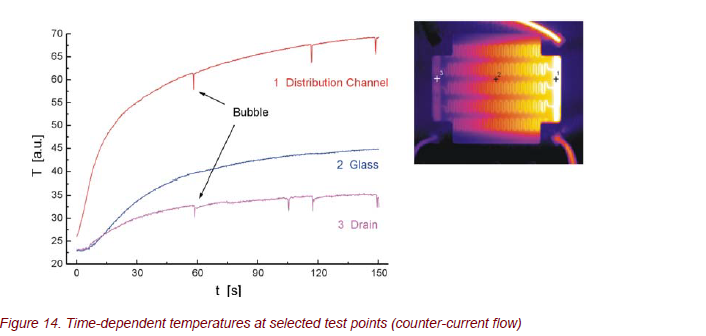
The IR images show a very smoothly varying temperature across the heat exchanger. Due to the small temperature gradient, system operation is remarkably homogeneous. This is shown in Figure 13. Obviously, all 5 meanders show about the same temperature gradient, especially for counter-current flow operation.
Time-resolved thermography offers the possibility of a detailed analysis of thermal processes, as shown for counter-current flow in Figure 14. Time-dependent temperatures at selected measuring points can be used to determine the time response and the heat transfer efficiency. The statistically occurring spikes of temperature are caused by small air bubbles within the channels. The apparent temperature change is caused by a temporary change of emissivity between water and air.
FURTHER APPLICATIONS TO MICROSYSTEMS
Micro Cryogenic Actuators
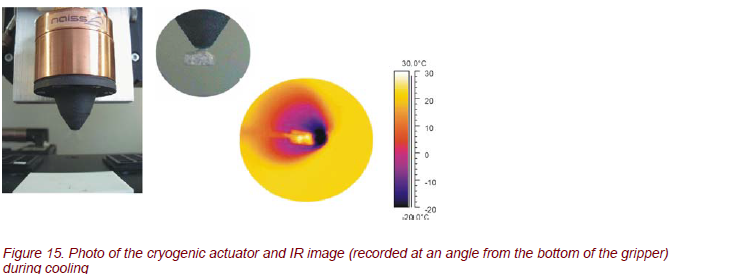
Cryo grippers from the NAISS GmbH Berlin, Germany [7], are a new patented kind of grippers that form a connection between the gripper contact surface and the object under study with freezing vapor (Fig. 15). This method can be used for any hydrophile material. The emerging connection creates a high holding force without straining the material. Cryo grippers can be used for automatic handling of microprobes, permeable to air, for non-rigid materials and miniaturized components without any tension force.
Time-resolved thermography appears to be a powerful tool for optimizing the handling process (cooling and heating). The gripping is based on water vapors in the vicinity of the material. Through an integrated nozzle, water vapor is sprayed on the gripping spots only. Freezing of the vapor is due to a Peltier cooling element.
This ensures freezing of small amounts of water within a second. The material will be picked up and dropped off at its destination. For dropping, the frozen vapor, i.e., ice, will be liquefied by heating, which melts the vapor and dries the material at the same time. The whole task takes only a few seconds.
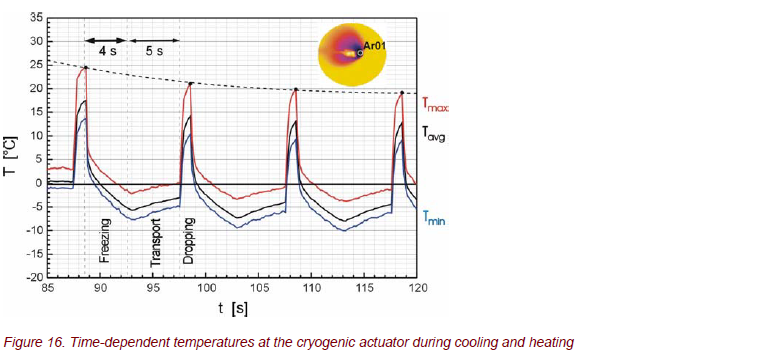
For the optimization and functionality of the gripper, a detailed knowledge of the thermal properties at the top of the gripper is necessary. Therefore, time-resolved measurements of the temperature distribution were carried out. Figure 16 shows the temperatures at the top of the gripper during periodic operations of freezing, transport, and heating. From these, the operating parameters are determined, i.e., the current for the Peltier cooler/heater at the top of the gripper with regard to the cycle times.
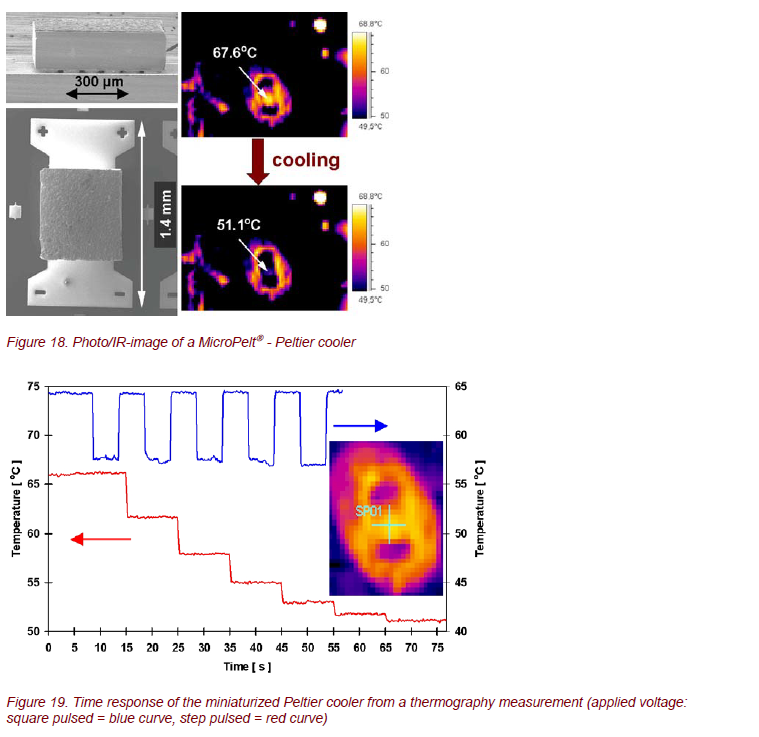
MICRO PELTIER COOLERS
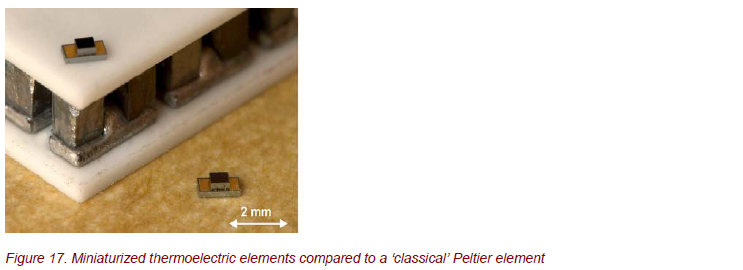
Micro Peltier coolers for spot cooling or temperature stabilization and microthermogenerators are in high demand for a lot of micro- and opto-electronic applications of the future, due to increasing miniaturization in these technological fields. Examples are chip cooling in microelectronics or temperature control for telecommunication lasers. These Peltier coolers and thermogenerators can offer typical advantages of microsystems, such as short response time and small area, combined with a high thermoelectric energy conversion. Infineon Technologies AG and Fraunhofer IPM developed the first Peltier devices based on the V-VI-compounds Bi2Te3 and (Bi,Sb)2Te3, which can be manufactured by means of regular thin film technology in combination with microsystem technology [8] (Fig. 17).
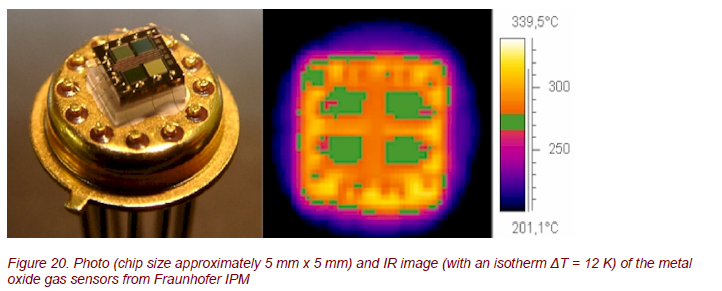
MicroPelt→, the new generation of thermo-electric components, was analyzed by thermography. Some examples are shown in Figures 18 and 19. Such optimized elements offer a lot of outstanding properties, such as cooling densities > 100 W/cm2, achievable temperature differences > 40 K, and a time response in the order of 10 ms [9, 10]. Obviously, contactless IR imaging techniques are extremely useful for time- and spatially resolved measurements of surface temperatures of these systems.
SEMICONDUCTOR GAS SENSORS
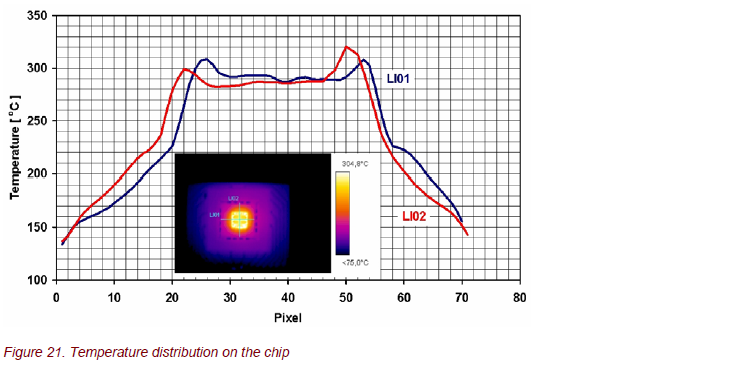
Gas sensors are of prime industrial interest due to their applications in important fields such as security, environment, control, automotive, and domestic applications. A particularly interesting class of gas sensors is based on the resistivity change of metal oxide semiconductor thin films induced by adsorbed gases. The reversible reactions of adsorption and desorption of different gases are controlled by the operational temperature (an integrated heater on the chip allows the variation of T between 150oC and 900oC) and the metal oxides used. Such sensors allow the analysis of various trace gases, such as COx, NOx, NH3, and hydrocarbons, down to minimum concentrations in the lower ppm range.
During the last decades, mostly thick film devices have been used, although their inherent high power consumption is undesirable, especially for portable systems. Meanwhile, the technological problems associated with production of thin film devices have been solved, and the Fraunhofer IPM [11] develops gas sensor arrays for implementation in commercial systems based on the combination of thin film deposition techniques, CMOS compatible microfabrication, and bulk silicon micromachining (Fig. 20). There are 4 quadratic gas-sensitive areas with the heater in the centre of the chip.
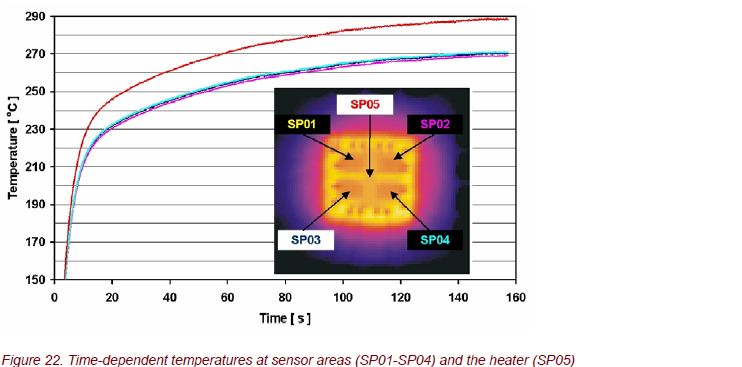
Thermography was used to analyze the surface temperature of the sensors, the thermal response time to heat up the sensor to the operational temperature, and the spatial temperature distribution on the chip (Fig. 20, 21). The temperature distribution is very homogeneous with ∆T ≈ 10 K.
The time response during heating is shown in Figure 22. Within a very narrow window, all 4 sensors stay the same, although their temperatures are continuously rising. The heating process shows two time constants: a very fast heating up at the beginning and then a slow temperature increase. Because the sensitivity strongly
depends on the sensor temperature, these results are now used to optimize chip structures to get a short-time response of the gas sensor.
SUMMARY
Thermography is a powerful tool in the development and optimization of a lot of microsystems, such as micrreactors, micro heat exchange systems, thermoelectric energy conversion systems, microactuators, and microsensors.
ACKNOWLEDGEMENTS
The authors wish to thank the IMM in Mainz, Germany; the Fraunhofer ICT in Pfinztal, Germany the mgt mikroglas AG in Mainz, Germany; the NAISS GmbH in Berlin, Germany; and Fraunhofer IPM in Freiburg, Germany for providing the microsystems used in this work.
REFERENCES
[1] Hessel, V., W. Ehrfeld, K. Golbig, V. Haverkamp, H. Löwe, M. Storz, Ch. Wille, A. Guber, K. Jänisch, and M. Baems. 2000. Conference Proceedings of the 3rd International Conference on Microreaction Technology, April 18-21, 1999. 526-40. Frankfurt am Maine, Germany: Springer-Verlag.
[2] Hessel, V., W. Ehrfeld, Th. Herweck. V. Haverkamp, H. Löwe, J. Schiewe, Ch. Wille, Th. Kern, and N. Lutz. 2000. Conference Proceedings of the 4th International Conference on Microreaction Technology, March 5-9, 2000. Atlanta, USA: AIChE.
[3] WILLE, CH., W. EHRFELD, V. HAVERKAMP, T. HERWECK, V. HESSEL, H. LÖWE, N. LUTZ, K.-P. MÖLLMANN, AND F. PINNO. 2000. “DYNAMIC MONITORING OF FLUID EQUIPARTION AND HEAT RELEASE IN A FALLING FILM MICROREACTOR USING REAL-TIME THERMOGRAPHY.” PROCEEDINGS OF MICRO.TEC 2000 VDE WORLD MICROTECHNOLOGIES CONGRESS, SEPTEMBER 25-27, 2000, EXPO 2000. HANNOVER, GERMANY: VDE VERLAG, BERIN UND OFFENBACH.
[4] Danckwerts, P. V. 1970. Gas/Liquid Reactions. 35, 37, 45, 47, 55. New York, USA: McGraw Hill Book Company.
[5] Marioth, E., S. Loebbecke, M. Scholz, F. Schnürer, T. Türke, J. Antes, H.H. Krause, N. Lutz, K.-P. Möllman, and F. Pinno. 2001. Investigation of Microfluidics and Heat Transferability inside a Microreactor Array Made of Glass.” Proceedings of 5th International Conference on Microreaction Technology, May 27-30, 2001. Strasbourg, France.
[6] mikroglas chemtech gmbh. URL: http://www.mikroglas.de/.
[7] NAISS GmbH. URL: http://www.naiss.de/.
[8] MicroPelt. URL: http://www.micropelt.com/.
[9] Böttner, H., J. Nurnus, A. Gavrikov, G. Kuhner, M. Jagle, C., Kunzel, D. Eberhard, G. Plescher, A. Schubert, and K.-H. Schlereth. “New Thermoelectric Components Using Microsystem Technologies.” Journal of Microelectromechanical Systems: 414-20
[10] Böttner, H. 2002. “Thermoelectric Micro Devices: Current State, Recent Developments and Future Aspects for Technological Progress and Applications.” Proceedings of the 21st International Conference on Thermoelectrics, August 25-29, 2002. Long Beach, USA.
[11] Fraunhofer IPM. URL: http://www.ipm.fraunhofer.de/
This work was partially supported by the applied research grant 17 094 02 from the German Federal Ministry of Education and Research.