Beware What You Cannot See: A Practical Application of the Use of IR Windows
InfraMation 2010 Application Paper Submission
John Pace
Energy Northwest; Columbia Generating Station
ABSTRACT
Past practices at Columbia Generating Station, a 1,150 megawatt power generation facility, relied on using infrared thermography to determine the thermal condition of enclosed electrical distribution equipment by monitoring the external housing temperatures of the energized equipment. High resistance conditions could possibly generate sufficient heat to increase the surface temperature of the enclosed cabinet or duct enough to be noticeable and then correctly diagnosed for its severity. To the author’s knowledge, this practice is prevalent throughout the industry for monitoring high voltage electrical equipment in which removing covers, panels, and doors for any maintenance reason is considered to be an extreme electrical safety hazard. . In many cases, the exposure of this dangerous equipment is forbidden by applicable electrical safety codes unless demanding and extreme electrical safety practices are observed. The removal of panels and covers to expose equipment such as a high voltage non-segregated and isophase distribution bus is a safety hazard no matter what personnel protective equipment is used.
Finding a thermal anomalies using thermal imaging at our facility increased our confidence in this practice. A section of 4160 VAC enclosed bus with abnormal heating was noted, documented, and repaired avoiding a serious imminent failure.
However, a recent catastrophic failure of a similar section of bolted and heavily insulated 6900 VAC bus at a flexible link location, in which thermal imaging did not detect any duct housing surface temperature increase, raised serious questions about our ability to make informed assessments of vital equipment condition.
As a result, infrared energy transmissive windows were installed and have restored our confidence in our ability to monitor and trend this important, powerful, and dangerous distribution equipment.
Six case histories describe the experiences that have led us to where we are today:
1) Two catastrophic failures that probably would have been detected had IR viewing windows been installed;
2) One case of a detected thermal abnormality that successfully identified an abnormal condition by the monitoring of an enclosed bus duct housing;
3) Three examples of the successful detection of abnormal conditions and overheating directly attributed to the use of IR windows without which the condition would have most likely not been detected, or at least correctly interpreted.
Significant economic expense was incurred in each of these events, although serious personnel injury was avoided. Had the successfully-detected anomalies gone undetected, the economic impact and the risk of personnel injury would have been far greater. It is the goal of this presentation that our experiences might increase awareness and provide an incentive to others. The use of infrared thermography techniques to monitor and maintain this dangerous equipment should be both an economic and safety priority.
INTRODUCTION
This paper will present and discuss the role that infrared viewing windows now have in our commercial power plant, and the events that occurred to define that role.
The equipment in question was only capable of being monitored with infrared thermography by measuring and trending the surface temperature of the duct or panel that houses the electrical conductors and connections inside, instead of by direct viewing after removing the duct or panel bolted covers. This is referred to as “indirect” temperature measurement. The primary reason this equipment is inaccessible for direct viewing and measurement is the safety risk involved in removing these duct and panel covers while the equipment is energized.
Case studies of six events will be presented involving overheating of dangerous and expensive high voltage enclosed electrical production and distribution equipment that have occurred at this station. Two were responsible for catastrophic failures. Two were imminent catastrophic failures that were avoided. One is a potential eventual failure mechanism noted by visual observation through the windows, which is a valuable additional benefit. The remaining event involved the early detection and subsequent monitoring of a thermal anomaly that would not be possible without the window installation.
The installation of viewing windows allows us to present in this paper both the visual and direct thermal images of the energized equipment that made it possible to discover, monitor, and conduct trend analysis on temperature abnormalities.
A short discussion of the acquisition techniques and data conversions necessary for quantitative temperature measurement trending through infrared energy transmissive windows is included.
CASE 1: 4160 VAC PUMP MOTOR JUNCTION BOX
A catastrophic failure in 1999 of an enclosed junction box for a 4160 VAC 5000 horsepower circulating water pump motor was the catalyst that initiated the installation of IR viewing windows. The junction box cover was too heavy and bulky for safe removal, so the thermographic survey was limited to monitoring the surface temperature for abnormalities. The external surface monitoring of these junction boxes seemed the only available option at the time.
Infrared viewing windows had only recently become commercially available. There was a lot of apprehension and numerous questions regarding the use of these early devices in UL-rated and tested cabinets. Did the installation itself create an additional safety issue? What happens to the safety rating of the cabinet with glass viewing windows installed instead of a homogeneous metal panel? These early issues did not make window installation an obvious choice.

Thermal imaging of this motor junction box, seen in Figure 1, done on a six month frequency, either did not reveal a noticeable temperature increase on the surface of this junction box, or the thermal data obtained was not recognized as abnormal or significant.
There are three of these motors in continuous operation when the station is at full power. Thermal imaging was performed on the other two redundant motor junction box covers immediately after this failure to determine if there was a similar issue in either.
The thermal imaging of the redundant motor junction box was performed prior to removing the cover (Fig. 2). This was done so that if a thermal issue was found when the cover was removed, it could be correlated to a surface heating delta T on the junction box cover surface. There was a 3°F variation in surface temperature noted across this cover.
Thermal imaging after the cover was removed (Figure 3) revealed this abnormality in the same location as the catastrophic failure in the other motor. This anomaly would not have been found without removing the cover based upon the surface heating pattern previously noted on this cover.

When the overheating condition was found inside this motor junction box, with no noted cover surface temperature indication, the station made its first large scale purchase of 350 viewing windows. Engineering staff evaluated and approved design modification documentation to allow the installation of viewing windows without undermining the structural integrity of the panel.

While the installation of viewing windows was a significant step forward in improving the infrared thermography program, there were still limitations. The non-segregated and isophase bus ducts had not been considered initially as candidates for this modification considering the expense and the belief that duct cover monitoring was sufficient. The basis for this belief will be more obvious in light of the Case 2 results.
CASE 2: 4160 VAC NON-SEGREGATED BUS ANOMALY NOTED BY MONITORING DUCT HOUSING
Using an indirect measurement process to monitor the surface temperature of this 4160 VAC non-segregated duct, a section of the duct was noted with what was determined to be abnormal heating relative to the remainder of the duct, and an adjacent duct. Arriving at this “problem/no problem” determination is the most difficult aspect of the indirect measurement process as there is no direct view of the connections under test, and other variables such as uneven bus loads can complicate the assessment even more. It is far easier to conclude that this elevated heating is a normal condition for this particular bus, rather than risk the chance of finding no problem at all when the cover is removed.
In looking at these two thermograms (Fig. 5), it is obvious that one duct is warmer than the others. But is it abnormal and is it a serious problem? The upper duct is similar in design and construction, but it only carries one-half of the load of the lower duct. The near duct is a 6900 VAC duct that again has less current load than the warmer duct.

The final conclusion reached was that this section seemed abnormally warm although not significantly, and that an IR window should be installed here to perform more detailed monitoring. The work was scheduled for a long-term maintenance shutdown.
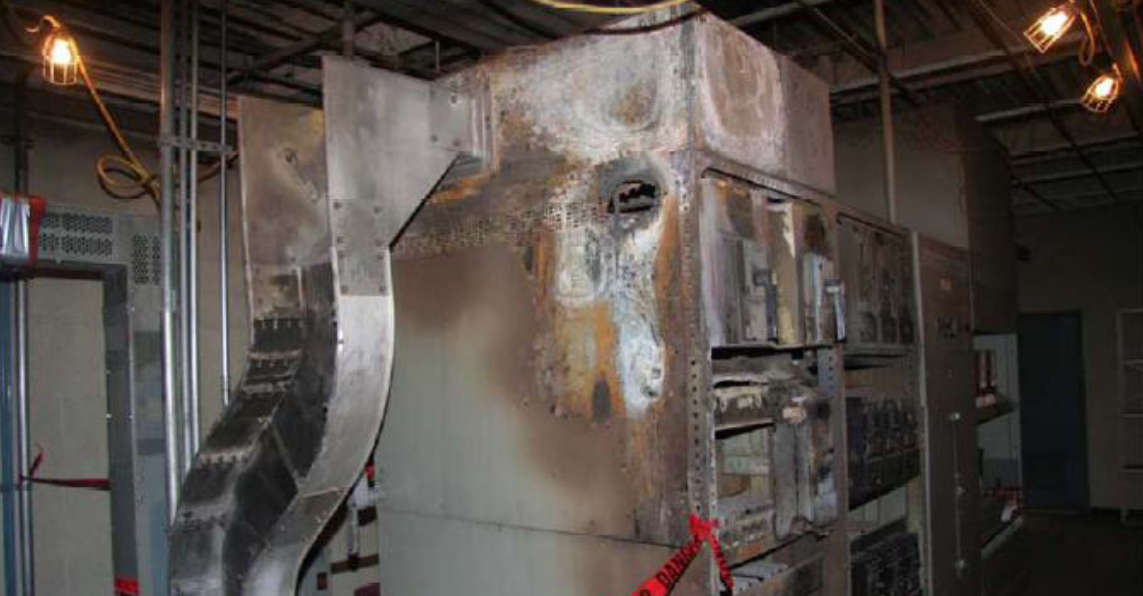
Extensive damage was found when the bus duct covers were removed for IR window installation (Fig. 6). Although the diagnosis was correct, the significance of the problem had been grossly underestimated. This component had remained in service and was a safety risk for longer than it should have been due to the severity assessment error. Visual and thermal observations of this connection through an IR window would have allowed for an accurate assessment of the damage and the condition severity. It was clear that in order to perform thermography of these enclosed ducts, viewing windows were necessary. The planning, scheduling, and budgeting for installing infrared viewing windows in all of our enclosed bus ducts was initiated.

Case 3: An Isophase Bus Duct Disconnect Link Failure Avoided Utilizing Installed IR Windows
Out of the initial batch of 350 IR windows that were purchased following the first catastrophic connection failure, one of the best window installation choices made was to install viewing windows on the isophase bus duct disconnect links to the three 25 - 500KV step-up transformers that deliver the power to our customers. These connections occur in an enclosed cabinet that is commonly referred to as the “doghouse”.

Thermography is routinely performed every 6 months on these connections and the entire main transformer yard. Prior to window installation, the only assessment of condition possible was to monitor the temperature of the bolted compartment covers. While an abnormal temperature rise would be a good indicator of a potential problem, again, determining condition severity would be difficult, if not impossible to estimate. See figure 9.
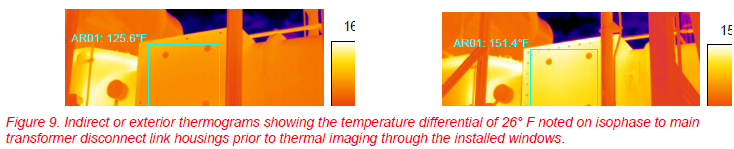
The decision to remove this component from service immediately may not have occurred based solely upon the 26°F degree rise noted on the external housing cover. The choice, however, was obvious based upon the direct thermal images obtained through the viewing window.

Note the temperature measurements of 309° – 503°F obtained. The temperature rating for the silver plating on this connection is up to 800°F, yet it is visibly dripping. The infrared radiation transmission through the viewing window glass is not 100%. The actual transmission percentage can be significantly less depending upon the material used for the window construction. The obtained measurements through the infrared viewing window must be multiplied by a correction factor to compensate for the transmission losses of the particular window being used. Examples of typical correction factors used for our specific windows will be shown at the end of this paper. Transmission losses need to be calculated in order to measure temperatures.
CASE 4: A 4160 VAC BUS DUCT FAILURE WITH NO INDIRECT TEMPERATURE MEASUREMENT WARNING
Although a decision had already been made to install viewing windows in enclosed bus ducts as a result of the Case 2 bus overheating damage, the planning effort and expense budgeting was significant and time consuming. This next incident rapidly accelerated our priority to complete this project. The incident involved a 6900 VAC non-segregated bus and associated duct. Thermal imaging surveys were again performed on the external duct every 6 months. Our previous experience with this type of bus had been successful in at least detecting abnormal heating. We were confident that a serious anomaly would be detected prior to any potential failure.

The thermal images above were taken on 4/24/09. The temperatures on all three ducts appear to be stable and reasonable. A catastrophic failure occurred very close to this recorded location on 08/05/09.

The catastrophic failure of this 6900 VAC bus occurred 4 months after performing a routine semi-annual surveillance. Thermal images taken (see Figure 11) did not reveal any indication of abnormal heating in this region. The failure mechanism was determined to be a high resistance connection of a bolted flexible link. The lack of any thermal warning of this impending failure destroyed all confidence in our ability to monitor enclosed bus by thermal viewing of the duct housing. Searches of previous industry experiences indicated that we were not alone. This time the plant would not be restarted before installing the viewing windows. Plant restart schedules provided for windows of opportunity during startup to acquire baseline thermographic temperature measurements through the increasing loads of startup through full power, and increased frequency monitoring is still in progress today acquiring valuable trending data.

The capability to perform reliable direct monitoring and temperature trending of internal bolted connections is now available following the installation of viewing windows in these bus ducts. We are no longer “flying blind” and are extremely confident in our ability to prevent future catastrophic failures.
CASE 5: VISUAL MONITORING CAPABILITIES OF DIRECT VIEWING
The ability to perform direct visual inspections of these once invisible bolted connections is an additional benefit that was not initially considered. While modern thermal imagers are capable of providing exceptional clarity and detail, there is also great value comparing the thermal image to what your eyes can see.

Thermal expansion of the bus is compensated for by having flexible links installed between bus bar sections. The expansion was greater than anticipated, resulting in an outward flexing of the links. This created a reduction in the distance between adjacent phases as well as connection seams between each segment of the bus housing that was conservatively addressed by installing “sock” type insulboots that minimized the outward flexing of the braided links. This condition would never have been noted without the direct viewing capability provided by the newly installed IR windows.
CASE 6: CURRENT ANOMALY DETECTION AND TRENDING
An “intermediate severity” thermal anomaly was noted during startup and routine predictive thermal imaging. The relatively low phase to phase temperature rise noted is not significant enough to provide an indirect temperature signature that would be recognized or correctly classified for severity without the use of the new viewing windows. With our new level of confidence in the temperature rise information, and with the ability to perform increased frequency monitoring of this flexible link location to detect any further degradation of this connection, reasonable service recommendations can be provided until such time as a repair can be performed. The repair can be performed when it fits our schedule instead of unnecessarily removing the equipment from service to repair a condition prematurely, or, conversely, not repairing it at all until the potential for another catastrophic failure exists because we were not aware of the condition.

UNDERSTANDING YOUR IMAGER/VIEWING WINDOW COMBINATION
As previously touched on, it is vitally important that the thermographer understand the effect viewing through an IR window has on the quantitative information that the imager is providing. The glass window is not totally transmissive to infrared energy. The camera/lens/window combination that will be utilized needs to have correction factors determined by controlled temperature measurement exercises that will compensate for the partial opaqueness of the viewing window to infrared radiation. A sample chart below illustrates the data needed to determine that correction factor for your specific equipment combination.
There are two different manufacturers’ IR viewing windows in use at our facility. Two different correction factor charts are required to obtain accurate temperature measurements depending upon which manufacturer’s window is being used.

As illustrated above in these charts, there can be a huge difference in infrared transmission ratios between manufacturers depending upon what material was used to construct the window.
Special Camera Considerations for Viewing through IR Windows
I have found a 90 Degree FOV lens to be immensely valuable for viewing thru IR windows. The additional field of view is invaluable for getting a great view through a small viewing window. Remember to create correction factors for the use of this lens through the windows being used.
SUMMARY
The installation of infrared viewing windows on currently inaccessible electrical equipment can provide a much more reliable and informative alternative to assessing critical equipment condition than can be obtained by monitoring the surface temperature of this equipment’s housing covers. In our personal experience, the expense has been recovered many times already and the safety consideration is priceless.
ACKNOWLEDGEMENTS
The author wishes to thank Energy Northwest for the initiative, confidence, and budget resources to install these invaluable thermography aides when it wasn’t popular to do so twenty years ago and now again recently when it is in all of our interest to provide a safe working environment for its employees. Additional thanks to unknown engineering personnel who provided several of the photographs contained in this paper.
ABOUT THE AUTHOR
John is a Level III thermographer and has been using the technology for over 25 years
Related Articles
-
 Thermography Fundamentals
Know Your Subject Matter
Read the Story -
 Electrical/Mechanical
Five Years of Infrared Results at CNA – March 2005 through June 2010
Read the Story -
 Electrical/Mechanical
Identifying Gear Alignment and Lubrication Concerns
Read the Story