Improved Sensitivity for Blower Door Thermography Using Image Subtraction
InfraMation 2010 Application Paper Submission
Pinno, K.-P. Möllmann and M. Vollmer,
Brandenburg University of Applied Sciences, Germany
ABSTRACT
In building inspections, blower door methods are used to determine air exchange rates by introducing well defined positive or negative pressure differences between the inside and the outside of the building. This technique has also been utilized in combination with thermography to visualize the heat transfer associated with the respective airflows through leaks. However, most investigations only analyze thermal images at well defined pressure. Although this is sufficient to find many thermal leaks, there is a more sensitive method to detect even the tiniest leaks. This paper will demonstrate the combination of the blower door method with image subtraction in thermal imaging to visualize air leaks which are difficult to find otherwise.
PROBLEMS OF CONVENTIONAL THERMOGRAPHY
Energy loss through building envelopes is not only costly, but it also creates environmental problems due to increased CO2 emission which can be produced from heating systems that use fossil fuels as the primary energy source. The rising public awareness of these issues encourages enhanced use of infrared thermal imaging during inspections of thermal building insulation.
Building thermography visualizes differences in surface temperatures of the building envelope (walls, windows, roof, etc.) These are due to two different causes: thermal bridges and air leaks. Thermal bridges have their origin either in geometry (e.g. wall corners) or in structural defects via conduction of heat (e.g. if two materials with different heat conduction are joined together). Whatever their origin, thermal bridges change the surface temperature distribution, and hence, are visible with thermography.
Air leaks in building envelopes are, on the one hand, planned in order to ensure that ventilation is sufficient. On the other hand, unplanned air leaks due to construction errors can be a source of major energy loss. Again, whatever the origin, air leaks in building envelopes create detectable surface temperature differences between adjacent, dissimilar materials.
Obviously, any IR image of a building will therefore depict detected surface temperature variations that could be caused by either thermal bridges or air leaks. Unfortunately, conventional thermography is not able to unequivocally differentiate between the two causes. Ordinarily, IR images of building parts (be it from inside or outside) can only reflect surface temperature anomalies, but the user cannot state the origin of these unless additional measurements are made.
Figure 1/left depicts a typical example for indoor building thermography visualizing this problem. The image depicts an outside wall of a kitchen of a private home, which is observed from inside. The visible image (bottom left) shows part of the window frame, the work plate beside the sink, and a wall segment covered with a protection plastic board which at one spot is interrupted by a wall socket. In the respective IR image (top left), one can see some leftover objects on the work plate, which should have been removed for proper inspection. But the most prominent features are the window frame and the wall socket. At first glance the origin of the observed surface temperature anomalies is unclear. One could theorize that the window corner could be the source due to a thermal bridge or possibly an air leak. The true cause is not immediately apparent. For the socket, a rational first guess would have been that neither a thermal bridge nor an air leak could be the source of the problem since the socket is in the middle of the outside wall. However, a closer look (bottom left) reveals that the socket temperature decrease is indeed due to an unexpected air leak (at position B). This becomes obvious when comparing the IR image to a visible image (bottom right) before plaster and tiles covered the wall. The socket was placed exactly on an exposed joint (C) between the bricks. The window frame corner (A) was determined to be air tight by the construction company and thus the associated heat transfer is thought to be caused by conduction.

Figure 1 nicely demonstrates that conventional IR thermography can detect both thermal leaks due to thermal bridges and those due to air leaks. However, the IR images alone are not sufficient to determine which of the two causes is responsible for the observed features. Since this information can be crucial for the inspection report, one needs an additional tool to differentiate between thermal bridges and air leaks. This tool is available for building inspections.
CONVENTIONAL BLOWER DOOR TECHNOLOGY
Recently, the blower door method1 has been combined with thermography 2-5 to provide a powerful tool for building diagnosis. This technique was originally developed to determine air exchange rates. The air exchange rate is a number which describes the air volume exchange per time with regard to the volume of the building. The measurement is done by creating a well-defined positive or negative pressure difference between the inside and the outside of a building (see Fig. 2).

The measuring system consists of a fan, pressure gauge, controller, and frame system for air tight installation into the window. For standardization of the air exchange rate, one usually measures at a standard pressure difference of 50 Pa between the inside and the outside of buildings to get n50.
A rather new building (built 2008, see Fig. 8) with standard thermal insulation and natural ventilation was analyzed. The air flow between the inside and outside of building was measured as a function of negative pressure difference (Fig 3). With a heated building volume of 309 m³, the standardized air exchange rate n50 at a negative pressure difference of 50 Pa and with an air flow of 631m³h-1 at 50 Pa is found to be:
n50 = air flow/building volume = 631m³h-1/ 309m³ = 2.04 h-1. (1)
A value of n50 =2h-1 means that the air volume inside the analyzed building is exchanged 2 times per hour at an inside pressure difference of 50 Pa. This air exchange rate was below the maximum allowed limit value of n50 = 3 h-1[6] for buildings with natural (window) ventilation. For buildings with air conditioning units, the maximum allowed limit value would have been lower at n50 = 1 h-1.6

Blower door techniques can increase the sensitivity of thermography (Figures 2-5 and 7). This is due to the applied pressure difference which induces air flow through leaks. If the temperature of the flowing gas differs from the one of the wall or the building envelope generally, heat transfer occurs between gas and envelope. This ultimately leads to a change of surface temperature of building parts adjacent to the air leaks.
Figure 4 is a typical example depicting this effect via a combination of blower door method and IR imaging. The figure shows IR images with (left) and without applied pressure difference of 50Pa (left) of part of the outside wall of a building observed from inside with entrance door and inside stairway. The two images look quite similar, but a closer inspection reveals that part of the door sealing as well as the light switch are much colder with applied pressure difference.
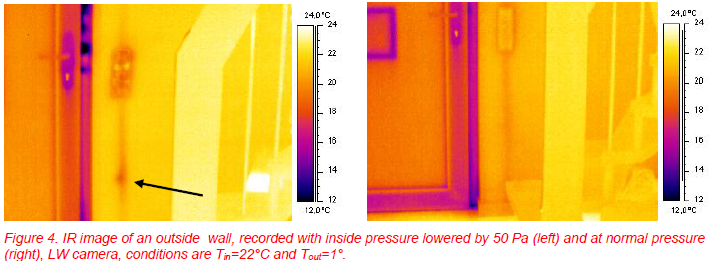
Interpretation of these IR images is supported by the visible images (Fig. 5). The detected lower surface temperatures below the light switch are due to the cold air flow through the cable trench from the exterior power socket. This example demonstrates that IR imaging combined with the blower door method enhances the sensitivity, i.e. the problems are considerably more visible in the IR images when blower door technology is used.

However, the respective IR images can still not distinguish between surface temperature anomalies caused by thermal bridges and those caused by air leaks. Additionally, if the leaks are very small, they may still remain unnoticed. Furthermore, if air leaks are associated with thermal bridges, they may be hidden.
In order to further enhance the sensitivity of the method and allow us to differentiate between thermal bridges and small air leaks, we applied the method of image subtraction7. Another method using Lock-In thermography was announced for this meeting.
IMPROVED BLOWER DOOR TECHNOLOGY USING IMAGE SUBTRACTION
Image subtraction is a simple image processing tool2 which is available in commercial camera software packages, for example, ThermaCAM Researcher or FLIR’s ExaminIR9. When blower door technology and thermography image subtraction are used together, an image is recorded at normal pressure and a second is recorded at reduced pressure. One image is then subtracted from the other. The resulting image enhances the differences induced by the pressure difference, only. The method has been successfully applied in building inspections to locate tiny leaks.
The first example, Fig. 6, depicts a window frame in the kitchen recorded at normal pressure (left) and reduced pressure (right). Both images reveal features around the frame although they are more pronounced for reduced pressure. The visible image (Fig 7. right) does not give any hint to these observed temperature anomalies.

Fig. 7 left depicts the result of image subtraction of the two IR images in Fig. 6. The temperature scale is given in units of dC which means temperature difference of the two images in centigrade. The geometrical thermal bridges of the window frame are more or less absent in the resulting image and only the areas of reduced pressure (i.e. the induced air flow effects) are visible. Therefore, the only features in the Fig. 7 image visible are the air leaks. In addition to the previously detected leaky blind box (A) and an improperly sealed opening into the blind box (B), the subtracted image also shows a very tiny leak (C) due to a defective gasket.
The second example deals with the analysis of a sun lounge in the same house (Fig. 8). The sun lounge is wood construction with triple pane windows (for low U values2). Due to variable moisture content, wood can shrink or expand with the weather. Therefore, a common problem is that tiny air leaks may occur at connections between the wood and bricks or window frame.

Figures 9 and 10 depict IR images of part of the window section using normal and reduced pressure. At reduced pressure (Fig. 9 right), it is possible to easily locate the air leak, a defect in the seal tape between brick wall and wooden material. The image subtraction as well as the visible image of the window is shown in Fig. 10.
The image subtraction approach offers higher sensitivity as can be seen from an otherwise invisible small air leak (B),due to a defective gasket between plastic window frame and wooden material (Figure 10). However, Fig. 10 also reveals a typical problem that might be encountered when using image subtraction with the blower door technique.


Surprisingly, the subtracted image not only shows air leaks. In addition, the plant leaves are clearly visible, although they are obviously not subjected to an air flow from outside. The explanation is quite simple: in this case, the time difference between the recording of the two images was about 30 minutes. During this half hour, ambient conditions have changed and the plant leaf temperature has increased, which means that unexpected additional structures may show up in the image. Such artifacts can, of course, be minimized, if the time between the two images is reduced. Therefore, consideration of time scale is necessary for accurate measurements with few artifacts.
TIME SCALES FOR REACHING STATIONARY CONDITIONS IN BLOWER DOOR MEASUREMENTS
A blower door measurement is done with a powerful fan. The first IR image is recorded before the fan is turned on and the second IR image is recorded after a stationary pressure equilibrium at 50 Pa pressure difference to atmospheric pressure is reached. Therefore, the first question is we must answer is: How long does it takes to reach the desired pressure difference? From pressure measurements (inside sensor about 3 m from fan, outside sensor about least 10 m from house), we find that for our experimental set-up, pressure equilibrium conditions are reached within 5 seconds after turning the fan on. This period is so short that we cannot expect that thermal equilibrium of the surfaces close to an air leak will change their temperature similarly fast (thermal phenomena are always slow if large thermal masses are involved).
Therefore, the second question is: How long does it take to reach a thermal equilibrium at surfaces close to the air leaks? This problem can be solved experimentally by measuring surface temperatures as a function of time after the fan is turned on. Fig. 11 depicts a measurement spot within the corner of the sun lounge. The measured minimum temperatures are plotted as a function of time in Fig. 12.


MORE EXAMPLES
- a) Trapdoor in the Roof with Air Insulation
The roof of the house was built without thermal insulation as a so-called cold roof. This means that in winter (Figures 13, 14) and summer (Figure 15), there are high temperature differences between the residential area below and the thermally-insulated attic. For inspection purposes, a trapdoor is usually installed in the ceiling, ideally well-insulated and air tight. Figure 13 depicts this trap door at normal and 50 Pa lower pressure in winter (Tattic=2°C). The thermal insulation is nominal and when comparing the two images, it seems at first glance that there are no major differences indicating air leaks. However, the image subtraction of these two images reveals several tiny air leaks, for example, a defective gasket (A) and a loose screw connection in the frame of the trap door (Figure 14). Since the temperature differences are small, these tiny leaks are not critical for energy loss, but it is possible that warm, wet air infiltration from the residential area to the attic at normal pressure conditions could lead to mold problems.

- b) Chimney Connection
Ordinary chimney constructions are often not air tight. Figure 16 depicts a typical example of a connection of the stove pipe to the chimney. Although the stovepipe is properly connected to the chimney pipe and not leaking, air is leaking through the connection between the brick wall and the chimney. This cold air infiltration is not only cooling down the wall area around the leak, but also the single shell flue gas pipe itself. The cause of this relatively large leak is not the metal to metal connection between stove pipe and flue gas pipe in the chimney. Rather there is a connection problem between the concrete brick (material of flue) and the metal ring of the gasket (see Figure 16 right). At first glance, this leak seemed to be quite dangerous and need of immediate attention since it could be possible for poisonous exhaust gases like CO to enter the living area.

- c) Front Door Problems, Thermal and Air Leak
Paned front doors are fancy, but window frames in doors are often sources of thermal bridges. Figure 17 depicts two IR images at ambient and reduced pressure. The direct comparison of these two images seems to indicate an air leak at the door seal, but it is not clear whether there are also leaks at the window segments of the door. The problem is solved by studying the subtracted image (Figure 18) which clearly shows that there is only one air leak (B) and the window panes just reflect normal thermal bridges (A).
The cause of the air infiltration shows up in the visible image from outside (Figure 18 right): a gap with a dimension of ca. 2 mm between door gasket and door frame was found. The defect is significant; this door was deformed just one year after installation and the gasket had to be realigned.


SUMMARY
The combination of the blower door method for measuring air tightness of buildings and image subtraction in thermal imaging of building envelopes has been investigated for a variety of different problems. Visualization of air leaks and the time-dependent cooling process of locations of air infiltration have been investigated, revealing that measurements should be done, at most, after several minutes of operating the fan. Compared to regular thermal imaging, subtraction of images at normal pressure and at inside pressure lowered by 50 Pa, is a very sensitive method to detect extremely small leaks as well as cable trenches, defective gaskets, seal tapes, shakes or gaps, which are difficult to find otherwise.
REFERENCES
[1] Minneapolis blower door systems; http://www.energyconservatory.com/products/products1.htm [2] Vollmer, M.; Möllmann, K.-P.; “Infrared thermal imaging, fundamentals, research and applications” Wliley-VCH, Berlin 2010, ISBN-10: 3-527-40717-0
[3] Steinbronn, L.; “Building air barrier testing and verification using infrared thermography and blower doors as part of the building commissioning process”, Inframation 2006 Proceedings, Vol. 7, 129-144 [4] Schneider, M.; Venn, B.; “Old and new: an application for blower doors and thermal cameras” Inframation 2009 Proceedings, Vol. 10, 197-207
[5] Vics, H.; “Use of the blower door with IR/Thermal Imaging for residential building diagnostics”, Inframation 2009 Proceedings, Vol. 10, 293-302
[6] DIN 4108-7; Wärmeschutz und Energie-Einsparung in Gebäuden - Teil 7: Luftdichtheit von Gebäuden, Anforderungen, Planungs- und Ausführungsempfehlungen sowie – beispiele (Thermal insulation and energy economy in buildings – Part 7: Air tightness of buildings, requirements, recommendations and examples for planning and performance); 2009-01, Deutsches Institut für Normung e.V., Berlin
[7] C. Tanner; Interpretation von Wärmebildern; QC-Expert AG Dübendorf (2009); pp. 47-49 [8] R. Danjoux, Lock-in Blower Door Technique To Enhance the Thermographic Visualization of Extremely Small Air Leaks, abstract Inframation 2010
[9] http://www.flir.com/thermography/americas/us/content/?id=18952
[10] Vollmer, M.; Möllmann, K.-P.; Pinno, F.; “Cheese cubes, light bulbs, soft drinks: an unusual approach to study convection, radiation, and size dependent heating and cooling”, Inframation 2008 Proceedings, Vol. 9, 477-492
[11] Vollmer, M.; “Newton´s law of cooling revisited” Eur. J. Phys., 30, 1063-1084 (2009)
ABOUT THE AUTHORS
Frank Pinno studied physics in Potsdam, Germany where he received his PhD (1991) in solid state physics. Since 1994, he has been employed as a scientific assistant (physics) at the University of Applied Sciences in Brandenburg, Germany, working in the field of infrared thermal imaging and in projects in the applied sciences. Frank is a Certified Level II Thermographer.
K.-P. Möllmann studied physics in Halle and Berlin, receiving his PhD in 1983 and Habilitation (1989) in solid state physics, in particular in the development of HgCdTe infrared detectors. Since 1994, he has been a professor of physics at the University of Applied Sciences, in Brandenburg, Germany. He has worked in infrared thermal imaging, pyrometry, thin film, and MEMS technology, and is a Certified Level II Thermographer. He is coauthor of the new practitioner textbook “Infrared Thermal Imaging – Fundamentals, Research and Applications” (Wiley, 2010).
Michael Vollmer studied physics in Heidelberg, Germany, receiving a PhD (1986) and Habilitation (1991) in optical spectroscopy of metal clusters. Since 1994, he has been a professor of physics at the University of Applied Sciences in Brandenburg/Germany, working in the fields of infrared thermal imaging, spectroscopy, atmospheric optics, and didactics of physics. He is a certified Level II Thermographer. He is coauthor of the new practitioner textbook “Infrared Thermal Imaging – Fundamentals, Research and Applications” (Wiley, 2010).
Related Articles
-
 Thermography Fundamentals
Know Your Subject Matter
Read the Story -
 Electrical/Mechanical
Five Years of Infrared Results at CNA – March 2005 through June 2010
Read the Story -
 Electrical/Mechanical
Identifying Gear Alignment and Lubrication Concerns
Read the Story