Infrared Thermography: Its Use and Application for Detecting Infectious Diseases in Wildlife and Domestic Animals
InfraMation 2010 Application Paper Submission
Shylo R. Johnson and Mike R. Dunbar
USDA/APHIS/WS/National Wildlife Research Center, Fort Collins, CO
ABSTRACT
Remarkable advances and recent research indicate that infrared thermography (IRT) can be used to remote detect infectious diseases in wildlife and domestic animals. Research has shown that IRT can be used to detect some diseases before the development of clinical signs and shedding of the pathogen, which may reduce transmission of diseases such as foot-and-mouth. Recent research has also indicated IRT can detect rabies in captive wildlife and we have expanded on that research to determine IRT’s application in the field. Other research includes assessing IRT’s application potential for detecting classical swine fever, bovine tuberculosis, avian influenza, and other infectious diseases. This research often focuses on identifying a thermal pattern that may be unique for the disease, but many times the first sign of an infectious disease is an increase in body temperature. Research on infected ponies and mule deer has indicated a correlation between IRT eye temperature and body temperature. Although there are obstacles that persist with use of infrared thermography to accurately detect diseases in animals, its potential in disease detection applications is promising. Continued research is providing a better understanding of the utility of such a technique, especially in the field.
INTRODUCTION
“Zoo weighs further testing: TB procedure on animals runs risk of causing harm.” This headline appeared in the Topeka Capital-Journal after the Topeka Zoo lost a chevrotain during tuberculosis testing (Carlson 2010). Capture myopathy, caused by stress due to handling and restraint, was one cause sited as contributing to the death. Injury or death to the animal, and occasionally to people restraining the animal, is always a concern when an animal must be restrained either physically or chemically.
Disease transmission is another concern in handling animals. If biosecurity measures for handling animals are inadequately followed, indirect transmission of diseases to other animals, or direct transmission of zoonotic diseases to humans could occur. Biosecurity measures also help prevent direct transmission between animals and are necessary to prevent outbreaks. Wide scale screening for diseased animals before they have contact with other animals is a much-needed biosecurity measure. Such a screening method needs to be rapid, remote, and noninvasive for practical implementation. In the 2001 foot-and-mouth disease outbreak in the United Kingdom, veterinarians had to inspect thousands of individual animals for clinical signs of the disease (Davies 2002). This inspection often required each animal to be handled to look for the most common sign, lesions.
As a remote and noninvasive tool for evaluating certain physiological changes in an animal, infrared thermography (IRT) has potential to reduce handling and be effective in biosecurity programs. Research is necessary to identify the degree and location of surface thermo-physiological change so IRT can help detect disease.
Research using IRT in animal disease detection began over 30 years ago. Merkal et al. (1973), using an AGA Thermovision, detected thermal skin changes from different tuberculin injections in calves exposed to Mycobacterium paratuberculosis. Since then, as cameras have improved, especially in resolution, interest in IRT application has grown. Thus, it is important to not only conduct the research, but to share what is being accomplished with multiple audiences.
This paper highlights our research and opportunities using IRT to detect surface thermal changes in animals infected with different diseases. The first section provides information on cameras, software, and some of the methods. The case studies that follow focus on the areas examined for temperature changes, the primary findings, and how these findings may be applied to IRT use. The final example discusses the use of IRT for measuring body temperature instead of focusing on a disease. When available, references to other publications or presentations that provide more details are provided.
CAMERAS AND GENERAL METHODS
Data collection was performed with the E65 and the EX350 cameras. The resolution of these cameras is 160 x 120 and 320 x 240, respectively. The white-hot grey palette and area max measurement mode were most commonly used. The grey palette facilitated focusing and the area max mode assisted in acquiring the temperature of the target area in the least amount of time, critical when imaging a moving animal. Additionally, the area max mode provided the most information from the thermograms when evaluated with the basic software, ThermCam Quickview 1.3. This software was used in all the examples. Reporter 8.3 was also used to add measurement modes to the thermographic image and to facilitate data entry into EXCEL and ACCESS for statistical analysis. Thermograms were corrected for distance, humidity, and ambient temperature. Emissivity was set at 0.95 or above, since the focus was often on skin temperature changes. When possible, thermograms were collected at least daily. However, this did not always occur for the opportunistic IRT evaluations.
CASE EXAMPLES - FOOT-AND-MOUTH DISEASE
Surface changes associated with foot-and-mouth disease (FMD) include lesions that occur in the mouth, on the teats, and on the feet. These areas of lesion development are the probable areas associated with temperature changes allowing the use of IRT for disease detection. Thermograms of the mouths and feet of mule deer exposed to the FMD virus revealed that only the thermograms of the feet provided information useful in disease screening; foot temperatures significantly increased as lesions developed (Figure 1; Dunbar et al. 2009). This increase started forty-eight hours before any lesions were observed indicating that disease detection before lesion development may be possible. Similar results in cattle were documented by Rainwater-Lovett et al. (2009). In an opportunist evaluation of swine exposed to the FMD virus, temperature
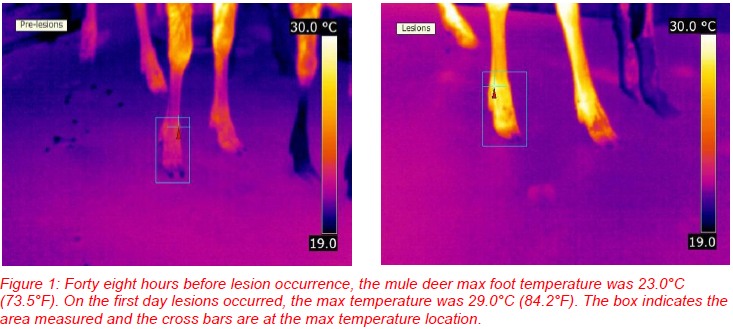
differences in the feet could easily be observed (Figure 2). Increased foot temperature is not expected to be a thermogram unique to FMD. Injury and other diseases affecting the feet may result in a similar response. Due to the highly infectious nature of FMD, effective control requires rapid detection and containment. Instead of handling individual animals to examine for lesions, IRT could be used to screen a herd or other collection of animals for perhaps individuals with elevated foot temperatures and then isolating that animal or animals for further testing and identification of the cause of the elevated foot temperature.

While FMD has surface areas intuitively associated with potential temperature changes, rabies does not. Rabies impacts the neurological system resulting primarily in behavioral changes. However, examination of thermograms of captive raccoons inoculated with rabies yielded positive results. The nose temperature significantly increased when the animals presented clinical signs (Figure 3; Dunbar and MacCarthy 2006). This study demonstrated that IRT could be a potential tool for antemortem screening of rabies and detection of rabies in animals, particularly raccoons, when no other signs are present. Application of IRT to detect rabies is being evaluated further. During field capture of raccoons caught for the purpose of rabies vaccination and release, research is being conducted on how ambient conditions, sunlight and temperature, may influence the appearance of the animals in the thermograms.
CLASSICAL SWINE FEVER
As the name indicates, a primary clinical sign of classical swine fever (CSF) is fever, which starts after an incubation period of two to six days and persists to the terminal stage. Lesions may also occur and are most often observed on the extremities (Kahn 2008). During an opportunistic evaluation of swine inoculated with CSF virus, initial viewing of the thermograms indicated visual increases in temperature, with occasional changes from cool to hot noted in the ears and feet. Thus, max infrared temperatures were acquired from the edge of the ear, one foot, and body surface area (SA) to look for temperature changes. The SA was the max temperature measured at any possible location on the body. Depending on the thermogram, this could be inside of the hind legs or on the back of the animal. Changes were observed in all three areas (Figure 4). Before inoculation, the mean temperatures of the group-housed pigs were 24.4°C (75.9°F), 25.1°C (77.2°F), and 29.6°C (85.3°F) for the ear, foot, and SA, respectively. By at least Day 6 post inoculation, the mean temperatures were 30.2°C (86.4°F), 37.1°C (98.8°F) and 39.6°C (103.3°F), respectively. Since these animals were housed together, individual responses were not determined. Also as an opportunistic evaluation, thermograms were not collected on daily basis and trends before Day 6 post-inoculation may have been missed, especially since rectal temperatures were reported to be elevated as early as Day 2 post-inoculation. The documented temperature difference may have been to due to the fever, but other factors, such as lesion development, may warrant further examination as a cause.

BOVINE TUBERCULOSIS
Animals infected with Mycobacterium bovis, the organism causing bovine tuberculosis (TB), may remain asymptomatic for extended periods of time. Current approved tests are often successful at detecting TB in asymptomatic animals; however, testing can require up to four handling events as in the case of the chevrotain death (Carlson 2010); the use of IRT as a diagnostic could reduce the number of handling events. TB-testing consists of tuberculin injections, with a delayed induration response occurring in positive animals at the site of the injection. In cattle, this response resulted in a localized heat increase that allowed IRT to be used to classify the cattle with 87% accuracy (Figure 5; Johnson and Dunbar 2008). Using IRT to classify an animal as a reactor occurred in less time (24 hrs) than the standard method (48/72 hrs) and with less restraint (corral vs. chute). With the correct measurement mode (e.g. area max), the classification could occur at the same time the thermogram is taken, increasing the practicality of using IRT during TB testing.

Elk and deer are also subject to TB testing. In a study evaluating the use of IRT in TB testing of elk, the results were not as promising. The induration response was not as pronounced in the elk as it was in the cattle. Thus, the temperature changes were probably less and the target area smaller. With less skin temperature change and a smaller surface area, factors influencing IRT accuracy and skin temperature likely confounded the results. This study occurred outside and was subjected to the ambient conditions including rain, sun, and ambient temperatures ranging from 7.43°C (45.4°F) to 26.3°C (79.4°F) which could have influenced both IRT accuracy and skin temperature. This emphasizes the need to find methods to account for factors affecting IRT measurements; these methods may only require changing the humidity and ambient temperature values in the IRT camera or software, or it may require the development of a model that accounts for influence of moist skin and ambient temperature on IRT measurements.
AVIAN INFLUENZA
For the more virulent strains of avian influenza such as highly pathogenic avian influenza (HPAI), cyanosis of the head, comb, and wattle can occur. Edema may also occur along with ecchymosis (Kahn 2008). These symptoms may or may not result in temperature changes. In an opportunity to evaluate chickens inoculated with HPAI, examination of the maximum head temperature of the thermograms from pre-inoculation up to four days post-inoculation indicated a decrease in temperature for the first two days post-inoculation. However, biosecurity measures implemented after inoculation required covering of the camera with a thin plastic covering and data does not exist on how much heat was absorbed by this covering before being measure by the camera detector. Most or possibly the entire temperature drop observed could have been due to this biosecurity covering. Also, a comparison of temperatures of inoculated chickens versus temperatures of uninfected chickens did not substantiate the observed drop in temperature. Inoculated chickens had significantly higher temperatures (P<0.05) than the uninfected chickens on Days 1, 2, and 3 post-inoculation (Figure 6). On Day 4 post-inoculation, no significant difference occurred and before inoculation, no thermograms of uninfected chickens were collected. While these IRT observations had many possible factors (e.g. sex, age, comb type, camera covering, etc.) confounding identification of thermographic changes due to the disease, the observations did support that change may be occurring in the head area and research needs to focus on what factors have the most influence. The feet and legs may be another area to focus on due to the lack of feathers in these areas for many chicken breeds.

BODY TEMPERATURE
In humans, body temperature changes correlate with surface temperatures in the eye region (Ng and Kaw 2006). Thus, the eye region is an area to consider for detecting body temperature changes, such as a fever, in other mammals. Using domestic ponies challenged with Equine Herpes virus, which causes elevated body temperature, the max IRT temperature from the eye region were found to correlate with the temperature measured rectally, which is a standard for measuring body temperature (Figure 7; Johnson et al. 2009). Also, no significant difference was found after comparing the max eye region temperature with body temperatures from transmitters implanted in mule deer (Dunbar et al. 2009). These findings support using the IRT of the eye region to screen for febrile animals; for this application, like in FMD, individuals with an eye temperature above a select temperature would be further evaluated. In this case, the detailed evaluation would be to identity if the animal truly has a fever and what may be the cause.
SUMMARY
As the public becomes less tolerant of some methods used to control disease outbreaks (e.g. culling) and as awareness of the disease risk associated with events resulting in the congregation of animals (e.g. livestock auctions, horse races, fairs, etc.) grows, rapid noninvasive methods for disease detection are needed. IRT cameras can to meet that need. Current research is focusing on how to use IRT most effectively in disease detection, as the above examples indicate. These examples also demonstrate direct application of some of the current findings, and highlight areas of research that should continue. Thermal camera improvements for example, the increases in resolution that allow measurements to be acquired from greater distances or allow the target area to be smaller are also increasing the applicability of IRT for disease detection
The influence of ambient conditions and how they are dealt with are still significant obstacles to application of IRT, especially in field settings. With some exceptions (i.e. TB testing elk, field rabies detection), the presented examples occurred under relatively stable ambient conditions. Real world application will often not occur under ideal conditions and the thermographer will often not have the opportunity to wait for the conditions to improve. Further research must address how IRT may be utilized in different ambient conditions when measuring how animals regulate their surface thermo-physiology in response to different external conditions. With continued research, the use of IRT will become will find greater acceptance.
REFERENCES
Carlson, J. Zoo weighs further testing: TB procedure on animals runs risk of causing harm. The Topeka Capital-Journal 17 June 2010, http://cjonline.com 22 June 2010
Davies, G. The foot-and-mouth disease (FMD) epidemic in the United Kingdom 2001. Comparative Immunology, Microbiology and Infectious Diseases 25, 331–343; 2002
Dunbar, M. R. and K. A. MacCarthy. Use of infrared thermography to detect signs of rabies infection in raccoons (Procyon lotor). Journal of Zoo and Wildlife Medicine 37 (4): 518 523; 2006
Dunbar, M. R., S. Johnson, J. Rhyan, and M. McCollum. Use of infrared thermography to detect thermographic changes in mule deer (Odocoileus hemionus) experimentally infected with foot-and- mouth disease. Journal of Zoo and Wildlife Medicine 40: 296-301; 2009
Johnson, S.R. and M. R. Dunbar. Use of infrared thermography as an alternative method to evaluate the comparative cervical test (CCT) in cattle sensitized to Mycobacterium bovis or M. avium. Proceedings of 112th USAHA Annual Meeting 112: 101-102. October 23-29, 2008, Greensboro, NC; 2008
Johnson, S. R. S. Rao, S. B. Hussey, P. Morley, and J. L. Traub-Dargatz. Use of infrared thermography to measure body temperature in ponies. 113th USAHA Annual Meeting/ 52nd AAVLD Conference, 8-14 October 2009, San Diego, CA, 113 (In Press) (abstract only); 2009
Kahn, C.M. (ed). Merck Veterinary Manual. Merck & Co., Inc.Whitehouse Station, NJ USA. http://www.merckvetmanual.com; 2008
Merkal, R. S., A. B. Larsen, H. A. Nelson and A. C. Peir. Thermography of tuberculin reactions in cattle. Infection and Immunity, May, 805-808; 1973.
Ng, E Y K and G J LKaw. IR images and fever monitoring devices: physics, physiology, and clinical accuracy. In JD Bronizino (ed). Medical Devices and Systems, Biomedical Engineering Handbook, Vol 2, 3rd ed. pp. 24:1-20; 2006
Rainwater-Lovett, K., J. M. Pacheco, C. Packer, and L. L. Rodriguez. Detection of foot-and-mouth disease virus infected cattle using infrared thermography. Veterinary Journal. 180:317-324; 2009.
ACKNOWLEDGEMENTS
The authors wish to thank the many people who have helped with these different studies and opportunities.
ABOUT THE AUTHORS
Shylo Johnson is a biologist and Level I thermographer and has been using the technology for 4 years. Mike Dunbar is a research wildlife veterinarian and has had an interest in infrared thermography for over 5 years.
Related Articles
-
 Thermography Fundamentals
Know Your Subject Matter
Read the Story -
 Electrical/Mechanical
Five Years of Infrared Results at CNA – March 2005 through June 2010
Read the Story -
 Electrical/Mechanical
Identifying Gear Alignment and Lubrication Concerns
Read the Story